Capital city of Oklahoma, United States
For other uses, see Oklahoma City (disambiguation).
State capital city in Oklahoma, United States
Location within the United States
Show map of the United States
|
Oklahoma City
|
Oklahoma City National Memorial
|

Flag

Seal
|
| Nickname(s):
"OKC", "The 405", "Oklas", "Boomtown", "The Big Friendly",[1] "The City",[2]
|

Interactive map of Oklahoma City
|
Location within the state of Oklahoma
Show map of Oklahoma
|
Coordinates:
35°28′7″N 97°31′17″W / 35.46861°N 97.52139°W / 35.46861; -97.52139CountryUnited StatesStateOklahomaCounties
- Oklahoma
- Canadian
- Cleveland
- Pottawatomie
FoundedApril 22, 1889[3]IncorporatedJuly 15, 1890[3]Government
• TypeCouncil–manager • BodyOklahoma City Council • MayorDavid Holt (R) • City managerCraig FreemanArea
[4]
• City
620.79 sq mi (1,607.83 km2) • Land606.48 sq mi (1,570.77 km2) • Water14.31 sq mi (37.06 km2) • Urban
421.73 sq mi (1,092.3 km2)Elevation
[5]
1,198 ft (365 m)Population
(2020)
• City
681,054  • Rank62nd in North America
20th in the United States
1st in Oklahoma • Density1,122.96/sq mi (433.58/km2) • Urban
982,276 (US: 46th) • Urban density2,329.2/sq mi (899.3/km2) • Metro
[6]
1,441,695 (US: 42nd)
- Oklahoma Cityan
- Oklahoma Citian
Demonyms
GDP
[7]
• Metro$100.054 billion (2023)Time zoneUTC−6 (Central (CST)) • Summer (DST)UTC−5 (CDT)ZIP Codes
- 73101–73132, 73134–73137, 73139-73157, 73159-73160, 73162–73165, 73167, 73169–73170, 73172–73173, 73178–73179, 73184, 73189–73190, 73194–73196
Area code(s)405/572FIPS code40-55000GNIS feature ID1102140[5]Websitewww.okc.gov
Oklahoma City (), officially the City of Oklahoma City, and often shortened to OKC, is the capital and most populous city of the U.S. state of Oklahoma. The county seat of Oklahoma County,[9] its population ranks 20th among United States cities and 8th in the Southern United States. The population grew following the 2010 census and reached 681,054 in the 2020 census.[10] The Oklahoma City metropolitan area had a population of 1,396,445,[11] and the Oklahoma City–Shawnee Combined Statistical Area had a population of 1,469,124,[11] making it Oklahoma's largest municipality and metropolitan area by population.
Oklahoma City's city limits extend somewhat into Canadian, Cleveland, and Pottawatomie counties. However, much of those areas outside the core Oklahoma County area are suburban tracts or protected rural zones (watershed). The city is the eighth-largest in the United States by area including consolidated city-counties; it is the second-largest, after Houston, not including consolidated cities. The city is also the second-largest by area among state capital cities in the United States, after Juneau, Alaska.
Oklahoma City has one of the world's largest livestock markets.[12] Oil, natural gas, petroleum products, and related industries are its economy's largest sector. The city is in the middle of an active oil field, and oil derricks dot the capitol grounds. The federal government employs a large number of workers at Tinker Air Force Base and the United States Department of Transportation's Mike Monroney Aeronautical Center (which house offices of the Federal Aviation Administration and the Transportation Department's Enterprise Service Center, respectively).
Oklahoma City is on the I-35 and I-40 corridors, one of the primary travel corridors south into neighboring Texas and New Mexico, north towards Wichita and Kansas City, west to Albuquerque, and east towards Little Rock and Memphis. Located in the state's Frontier Country region, the city's northeast section lies in an ecological region known as the Cross Timbers. The city was founded during the Land Run of 1889 and grew to a population of over 10,000 within hours of its founding. It was the site of the April 19, 1995, bombing of the Alfred P. Murrah Federal Building, in which 167 people died,[13] the deadliest terror attack in U.S. history until the attacks of September 11, 2001, and the deadliest act of domestic terrorism in U.S. history.
Since weather records have been kept beginning in 1890, Oklahoma City has been struck by 14 violent tornadoes, 11 of which were rated F4 or EF4 on the Fujita and Enhanced Fujita scales, and two rated F5 and EF5.[14]
History
[edit]
Main article: History of Oklahoma City
For a chronological guide, see Timeline of Oklahoma City.
 Map of Indian Territory (Oklahoma) 1889, showing Oklahoma as a train stop on a railroad line. Britannica 9th ed.
| Native American names for Oklahoma City |
| Choctaw: TÊ‹maha chito Oklahumma |
| Cherokee: ᎣᎦᎳᎰᎹ ᎦášᎲᎢ |
| Romanized: ogalahoma gaduhvi |
| Cheyenne: Ma'xepóno'e |
| Comanche: Pia SookaÌ hni |
| Delaware: Oklahoma-utènaii |
| Iowa-Oto: Chína Chége Itúâ¿[15] |
| Navajo: Halgai Hóteeldi Kin Haalʼáhí |
| Meskwaki: Okonohômîheki[16] |
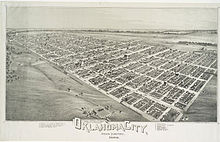
Oklahoma City was settled on April 22, 1889,[17] when the area known as the "Unassigned Lands" was opened for settlement in an event known as "The Land Run".[18] On April 26 of that year, its first mayor was elected, William Couch. Some 10,000 homesteaders settled in the area that would become the capital of Oklahoma. The town grew quickly; the population doubled between 1890 and 1900.[19] Early leaders of the development of the city included Anton H. Classen, John Wilford Shartel, Henry Overholser, Oscar Ameringer, Jack C. Walton, Angelo C. Scott, and James W. Maney.
 Lithograph of Oklahoma City from 1890.
 Looking north on Broadway from present-day Sheridan Ave, 1910.
By the time Oklahoma was admitted to the Union in 1907, Oklahoma City had surpassed Guthrie, the territorial capital, as the new state's population center and commercial hub. Soon after, the capital was moved from Guthrie to Oklahoma City.[20] Oklahoma City was a significant stop on Route 66 during the early part of the 20th century; it was prominently mentioned in Bobby Troup's 1946 jazz song "(Get Your Kicks on) Route 66" made famous by artist Nat King Cole.
Before World War II, Oklahoma City developed significant stockyards, attracting jobs and revenue formerly in Chicago and Omaha, Nebraska. With the 1928 discovery of oil within the city limits (including under the State Capitol), Oklahoma City became a major center of oil production.[21] Post-war growth accompanied the construction of the Interstate Highway System, which made Oklahoma City a major interchange as the convergence of I-35, I-40, and I-44. It was also aided by the federal development of Tinker Air Force Base after successful lobbying efforts by the director of the Chamber of Commerce Stanley Draper.
In 1950, the Census Bureau reported the city's population as 8.6% black and 90.7% white.[22]
In 1959, the city government launched a "Great Annexation Drive" that expanded the city's area from 80 to 475.55 square miles (207.2 to 1,231.7 square kilometers) by the end of 1961, making it the largest U.S. city by land mass at the time.[23]
Patience Latting was elected Mayor of Oklahoma City in 1971, becoming the city's first female mayor.[24] Latting was also the first woman to serve as mayor of a U.S. city with over 350,000 residents.[24]
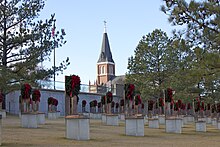 Oklahoma City National Memorial at Christmas.
Like many other American cities, the center city population declined in the 1970s and 1980s as families followed newly constructed highways to move to newer housing in nearby suburbs. Urban renewal projects in the 1970s, including the Pei Plan, removed older structures but failed to spark much new development, leaving the city dotted with vacant lots used for parking. A notable exception was the city's construction of the Myriad Gardens and Crystal Bridge, a botanical garden and modernistic conservatory in the heart of downtown. Architecturally significant historic buildings lost to clearances were the Criterion Theater,[25][26] the Baum Building,[27] the Hales Building,[28][29] and the Biltmore Hotel.[30]
In 1993, the city passed a massive redevelopment package known as the Metropolitan Area Projects (MAPS), intended to rebuild the city's core with civic projects to establish more activities and life in downtown. The city added a new baseball park; a central library; renovations to the civic center, convention center, and fairgrounds; and a water canal in the Bricktown entertainment district. Water taxis transport passengers within the district, adding color and activity along the canal. MAPS has become one of the most successful public-private partnerships undertaken in the U.S., exceeding $3 billion in private investment as of 2010.[31] As a result of MAPS, the population in downtown housing has exponentially increased, with the demand for additional residential and retail amenities, such as groceries, services, and shops.
Since the completion of the MAPS projects, the downtown area has seen continued development. Several downtown buildings are undergoing renovation/restoration. Notable among these was the restoration of the Skirvin Hotel in 2007. The famed First National Center is also being renovated.
Residents of Oklahoma City suffered substantial losses on April 19, 1995, when Timothy McVeigh detonated a bomb in front of the Murrah building. The building was destroyed (the remnants of which had to be imploded in a controlled demolition later that year), more than 100 nearby buildings suffered severe damage, and 168 people were killed.[32] The site has been commemorated as the Oklahoma City National Memorial and Museum.[33] Since its opening in 2000, over three million people have visited. Every year on April 19, survivors, families, and friends return to the memorial to read the names of each person lost. McVeigh was executed by lethal injection on June 11, 2001.
The "Core-to-Shore" project was created to relocate I-40 one mile (1.6 km) south and replace it with a boulevard to create a landscaped entrance to the city.[34] This also allows the central portion of the city to expand south and connect with the shore of the Oklahoma River. Several elements of "Core to Shore" were included in the MAPS 3 proposal approved by voters in late 2009.
Geography
[edit]
 Mid-May 2006 photograph of Oklahoma City taken from the International Space Station (ISS)
Oklahoma City lies along one of the primary corridors into Texas and Mexico and is a three-hour drive from the Dallas-Fort Worth metroplex. The city is in the Frontier Country region in the state's center, making it ideal for state government.
According to the United States Census Bureau, the city has a total area of 620.34 square miles (1,606.7 km2),[35] of which 601.11 square miles (1,556.9 km2) is land and 19.23 square miles (49.8 km2) is water.
Oklahoma City lies in the Sandstone Hills region of Oklahoma, known for hills of 250 to 400 feet (80 to 120 m) and two species of oak: blackjack oak (Quercus marilandica) and post oak (Q. stellata).[36] The northeastern part of the city and its eastern suburbs fall into an ecological region known as the Cross Timbers.[37]
The city is roughly bisected by the North Canadian River (recently renamed the Oklahoma River inside city limits). The North Canadian once had sufficient flow to flood every year, wreaking destruction on surrounding areas, including the central business district and the original Oklahoma City Zoo.[38] In the 1940s, a dam was built on the river to manage the flood control and reduce its level.[39] In the 1990s, as part of the citywide revitalization project known as MAPS, the city built a series of low-water dams, returning water to the portion of the river flowing near downtown.[40] The city has three large lakes: Lake Hefner and Lake Overholser, in the northwestern quarter of the city; and the largest, Lake Stanley Draper, in the city's sparsely populated far southeast portion.
The population density typically reported for Oklahoma City using the area of its city limits can be misleading. Its urbanized zone covers roughly 244 square miles (630 km2) resulting in a 2013 estimated density of 2,500 per square mile (970/km2), compared with larger rural watershed areas incorporated by the city, which cover the remaining 377 sq mi (980 km2) of the city limits.[41]
Oklahoma City is one of the largest cities in the nation in compliance with the Clean Air Act.[42]
Tallest buildings
[edit]
Main article: List of tallest buildings in Oklahoma City
| Rank |
Building |
Height |
Floors |
Built |
Ref. |
| 1 |
Devon Energy Center |
844 feet (257 m) |
50 |
2012 |
[43] |
| 2 |
BancFirst Tower |
500 feet (152 m) |
36 |
1971 |
[44] |
| 3 |
First National Center |
446 feet (136 m) |
33 |
1931 |
[45] |
| 4 |
BOK Park Plaza |
433 feet (132 m) |
27 |
2017 |
[46] |
| 5 |
Oklahoma Tower |
410 feet (125 m) |
31 |
1982 |
[47] |
| 6 |
Strata Tower |
393 feet (120 m) |
30 |
1973 |
[48] |
| 7 |
City Place |
391 feet (119 m) |
33 |
1931 |
[49] |
| 8 |
Valliance Bank Tower |
321 feet (98 m) |
22 |
1984 |
[50] |
| 9 |
Leadership Square North |
285 feet (87 m) |
22 |
1984 |
[51] |
| 10 |
Arvest Tower |
281 feet (86 m) |
16 |
1972 |
[52] |
Neighborhoods
[edit]
Main article: Neighborhoods of Oklahoma City
 Automobile Alley in Oklahoma City
 Looking up in the heart of Oklahoma City's Central Business District
Oklahoma City neighborhoods are highly varied, with affluent historic neighborhoods located next to districts that have not wholly recovered from the economic and social decline of the 1970s and 1980s.[citation needed]
The city is bisected geographically and culturally by the North Canadian River, which divides North Oklahoma City and South Oklahoma City. The north side is characterized by diverse and fashionable urban neighborhoods near the city center and sprawling suburbs further north. South Oklahoma City is generally more blue-collar working class and significantly more industrial, having grown up around the Stockyards and meat packing plants at the turn of the century. It is also the center of the city's rapidly growing Latino community.
Downtown Oklahoma City, which has 7,600 residents, is seeing an influx of new private investment and large-scale public works projects, which have helped to revitalize a central business district left almost deserted by the Oil Bust of the early 1980s. The centerpiece of downtown is the newly renovated Crystal Bridge and Myriad Botanical Gardens, one of the few elements of the Pei Plan to be completed. In 2021, a massive new central park will link the gardens near the CBD and the new convention center to be built just south of it to the North Canadian River as part of a massive works project known as "Core to Shore"; the new park is part of MAPS3, a collection of civic projects funded by a one-cent temporary (seven-year) sales tax increase.[53]
Climate
[edit]
Main article: Climate of Oklahoma City
Oklahoma City has a temperate humid subtropical climate (Köppen: Cfa, Trewartha: Cfak), along with significant continental influences. The city features hot, humid summers and cool winters. Prolonged and severe droughts (sometimes leading to wildfires in the vicinity) and hefty rainfall leading to flash flooding and flooding occur regularly. Consistent winds, usually from the south or south-southeast during the summer, help temper the hotter weather. Consistent northerly winds during the winter can intensify cold periods. Severe ice storms and snowstorms happen sporadically during the winter.
The average temperature is 61.4 °F (16.3 °C), with the monthly daily average ranging from 39.2 °F (4.0 °C) in January to 83.0 °F (28.3 °C) in July. Extremes range from −17 °F (−27 °C) on February 12, 1899 to 113 °F (45 °C) on August 11, 1936, and August 3, 2012;[54] The last sub-zero (Fahrenheit) reading was −14 °F (−26 °C) on February 16, 2021.[55][56] Temperatures reach 100 °F (38 °C) on 10.4 days of the year, 90 °F (32 °C) on nearly 70 days, and fail to rise above freezing on 8.3 days.[55] The city receives about 35.9 inches (91.2 cm) of precipitation annually, of which 8.6 inches (21.8 cm) is snow.
The report "Regional Climate Trends and Scenarios for the U.S. National Climate Assessment" (NCA) from 2013 by NOAA projects that parts of the Great Plains region can expect up to 30% (high emissions scenario based on CMIP3 and NARCCAP models) increase in extreme precipitation days by mid-century. This definition is based on days receiving more than one inch of rainfall.[57]
Extreme weather
[edit]
Oklahoma City has an active severe weather season from March through June, especially during April and May. Being in the center of what is colloquially referred to as Tornado Alley, it is prone to widespread and severe tornadoes, as well as severe hailstorms and occasional derechoes. Tornadoes occur every month of the year, and a secondary smaller peak also occurs during autumn, especially in October. The Oklahoma City metropolitan area is one of the most tornado-prone major cities in the world, with about 150 tornadoes striking within the city limits since 1890. Since the time weather records have been kept, Oklahoma City has been struck by 13 violent tornadoes, eleven rated F/EF4 and two rated F/EF5.[14]
On May 3, 1999, parts of Oklahoma City and surrounding communities were impacted by a tornado. It was the last U.S. tornado to be given a rating of F5 on the Fujita scale before the Enhanced Fujita scale replaced it in 2007. While the tornado was in the vicinity of Bridge Creek to the southwest, wind speeds of 318 mph (510 km/h) were estimated by a mobile Doppler radar, the highest wind speeds ever recorded on Earth.[58] A second top-of-the-scale tornado occurred on May 20, 2013; South Oklahoma City, along with Newcastle and Moore, was hit by an EF5 tornado. The tornado was 0.5 to 1.3 miles (0.80 to 2.09 km) wide and killed 23 people.[59] On May 31, less than two weeks after the May 20 event, another outbreak affected the Oklahoma City area. Within Oklahoma City, the system spawned an EF1 and an EF0 tornado, and in El Reno to the west, an EF3 tornado occurred. This lattermost tornado, which was heading in the direction of Oklahoma City before it dissipated, had a width of 2.6 miles (4.2 km), making it the widest tornado ever recorded. Additionally, winds over 295 mph (475 km/h) were measured, one of the two highest wind records for a tornado.[60]
With 19.48 inches (495 mm) of rainfall, May 2015 was Oklahoma City's record-wettest month since record-keeping began in 1890. Across Oklahoma and Texas generally, there was a record flooding in the latter part of the month.[61]
| Climate data for Oklahoma City (Will Rogers World Airport), 1991−2020 normals,[a] extremes 1890−present[b] |
| Month |
Jan |
Feb |
Mar |
Apr |
May |
Jun |
Jul |
Aug |
Sep |
Oct |
Nov |
Dec |
Year |
| Record high °F (°C) |
83
(28) |
92
(33) |
97
(36) |
100
(38) |
104
(40) |
107
(42) |
110
(43) |
113
(45) |
108
(42) |
97
(36) |
87
(31) |
86
(30) |
113
(45) |
| Mean maximum °F (°C) |
71.7
(22.1) |
77.1
(25.1) |
84.2
(29.0) |
86.9
(30.5) |
92.3
(33.5) |
96.4
(35.8) |
102.4
(39.1) |
101.5
(38.6) |
96.2
(35.7) |
88.9
(31.6) |
79.1
(26.2) |
71.2
(21.8) |
103.8
(39.9) |
| Mean daily maximum °F (°C) |
49.3
(9.6) |
53.8
(12.1) |
62.9
(17.2) |
71.1
(21.7) |
78.9
(26.1) |
87.5
(30.8) |
93.1
(33.9) |
92.2
(33.4) |
83.9
(28.8) |
72.8
(22.7) |
60.7
(15.9) |
50.4
(10.2) |
71.4
(21.9) |
| Daily mean °F (°C) |
38.2
(3.4) |
42.3
(5.7) |
51.2
(10.7) |
59.3
(15.2) |
68.2
(20.1) |
76.9
(24.9) |
81.7
(27.6) |
80.7
(27.1) |
72.7
(22.6) |
61.1
(16.2) |
49.2
(9.6) |
40.0
(4.4) |
60.1
(15.6) |
| Mean daily minimum °F (°C) |
27.0
(−2.8) |
30.8
(−0.7) |
39.5
(4.2) |
47.5
(8.6) |
57.6
(14.2) |
66.2
(19.0) |
70.3
(21.3) |
69.1
(20.6) |
61.5
(16.4) |
49.4
(9.7) |
37.7
(3.2) |
29.5
(−1.4) |
48.8
(9.3) |
| Mean minimum °F (°C) |
11.7
(−11.3) |
15.4
(−9.2) |
21.5
(−5.8) |
32.3
(0.2) |
43.8
(6.6) |
56.6
(13.7) |
63.6
(17.6) |
61.7
(16.5) |
48.4
(9.1) |
33.8
(1.0) |
21.7
(−5.7) |
14.3
(−9.8) |
7.5
(−13.6) |
| Record low °F (°C) |
−11
(−24) |
−17
(−27) |
1
(−17) |
20
(−7) |
32
(0) |
46
(8) |
53
(12) |
49
(9) |
35
(2) |
16
(−9) |
9
(−13) |
−8
(−22) |
−17
(−27) |
| Average precipitation inches (mm) |
1.32
(34) |
1.42
(36) |
2.55
(65) |
3.60
(91) |
5.31
(135) |
4.49
(114) |
3.59
(91) |
3.60
(91) |
3.72
(94) |
3.32
(84) |
1.68
(43) |
1.79
(45) |
36.39
(924) |
| Average snowfall inches (cm) |
1.8
(4.6) |
1.8
(4.6) |
0.8
(2.0) |
0.0
(0.0) |
0.0
(0.0) |
0.0
(0.0) |
0.0
(0.0) |
0.0
(0.0) |
0.0
(0.0) |
0.0
(0.0) |
0.5
(1.3) |
1.8
(4.6) |
6.7
(17) |
| Average precipitation days (≥ 0.01 in) |
5.0 |
5.7 |
6.9 |
7.9 |
10.0 |
8.6 |
6.0 |
6.7 |
7.1 |
7.5 |
5.8 |
5.7 |
82.9 |
| Average snowy days (≥ 0.1 in) |
1.3 |
1.3 |
0.4 |
0.1 |
0.0 |
0.0 |
0.0 |
0.0 |
0.0 |
0.1 |
0.3 |
1.4 |
4.9 |
| Average relative humidity (%) |
66.6 |
65.7 |
61.3 |
61.1 |
67.5 |
67.2 |
60.9 |
61.6 |
67.1 |
64.4 |
67.1 |
67.8 |
64.9 |
| Average dew point °F (°C) |
23.7
(−4.6) |
28.0
(−2.2) |
35.2
(1.8) |
45.1
(7.3) |
55.8
(13.2) |
63.7
(17.6) |
65.3
(18.5) |
64.4
(18.0) |
59.5
(15.3) |
47.7
(8.7) |
37.0
(2.8) |
27.5
(−2.5) |
46.1
(7.8) |
| Mean monthly sunshine hours |
200.8 |
189.7 |
244.2 |
271.3 |
295.2 |
326.1 |
356.6 |
329.3 |
263.7 |
245.1 |
186.5 |
180.9 |
3,089.4 |
| Mean daily daylight hours |
10.1 |
10.9 |
12.0 |
13.1 |
14.1 |
14.5 |
14.3 |
13.4 |
12.4 |
11.3 |
10.3 |
9.8 |
12.2 |
| Percent possible sunshine |
64 |
62 |
66 |
69 |
68 |
75 |
80 |
79 |
71 |
70 |
60 |
60 |
69 |
| Average ultraviolet index |
3 |
4 |
6 |
8 |
9 |
10 |
10 |
9 |
8 |
5 |
3 |
2 |
6.4 |
| Source 1: NOAA (relative humidity and sun 1961−1990)[62][55][63] |
| Source 2: Weather Atlas(Daylight-UV) [64] |
Demographics
[edit]
Population of Oklahoma City 1890-2022
| Census |
Pop. |
Note |
%± |
| 1890 |
4,151 |
|
— |
| 1900 |
10,037 |
|
141.8% |
| 1910 |
64,205 |
|
539.7% |
| 1920 |
91,295 |
|
42.2% |
| 1930 |
185,389 |
|
103.1% |
| 1940 |
204,424 |
|
10.3% |
| 1950 |
243,504 |
|
19.1% |
| 1960 |
324,253 |
|
33.2% |
| 1970 |
368,164 |
|
13.5% |
| 1980 |
404,014 |
|
9.7% |
| 1990 |
444,719 |
|
10.1% |
| 2000 |
506,132 |
|
13.8% |
| 2010 |
579,999 |
|
14.6% |
| 2020 |
681,054 |
|
17.4% |
| 2024 (est.) |
709,330 |
[65] |
4.2% |
In the 2010 census, there were 579,999 people, 230,233 households, and 144,120 families in the city. The population density was 956.4 inhabitants per square mile (321.9/km2). There were 256,930 housing units at an average density of 375.9 per square mile (145.1/km2). By the 2020 census, its population grew to 681,054.[71]
Of Oklahoma City's 579,999 people in 2010, 44,541 resided in Canadian County, 63,723 lived in Cleveland County, 471,671 resided in Oklahoma County, and 64 resided in Pottawatomie County.[72]
In 2010, there were 230,233 households, 29.4% of which had children under 18 living with them, 43.4% were married couples living together, 13.9% had a female householder with no husband present, and 37.4% were non-families. One person households account for 30.5% of all households, and 8.7% of all households had someone living alone who was 65 years of age or older. The average household size was 2.47 and the average family size was 3.11.[73]
According to the American Community Survey 1-year estimates in 2022, the median income for a household in the city was $63,713, and the median income for a family was $80,833. Married-couple families $99,839, and nonfamily households $40,521.[74] The per capita income for the city was $35,902.[75] 15.5% of the population and 11.2% of families were below the poverty line. Of the total population, 20.1% of those under 18 and 10.6% of those 65 and older lived below the poverty line.[76]
In the 2000 census, Oklahoma City's age composition was 25.5% under the age of 18, 10.7% from 18 to 24, 30.8% from 25 to 44, 21.5% from 45 to 64, and 11.5% who were 65 years of age or older. The median age was 34 years. For every 100 females, there were 95.6 males. For every 100 females age 18 and over, there were 92.7 males.
Oklahoma City has experienced significant population increases since the late 1990s. It is the first city in the state to record a population greater than 600,000 residents and the first city in the Great Plains region to record a population greater than 600,000 residents. It is the largest municipal population of the Great Plains region (Oklahoma, Kansas, Nebraska, South Dakota, North Dakota).[ambiguous]
In the 2020 census, there were 268,035 households in the city, out of which 81,374 households (30.4%) were individuals, 113,161 (42.2%) were opposite-sex married couples, 17,699 (6.6%) were unmarried opposite-sex partnerships, and 2,930 (1.1%) were same-sex married couples or partnerships.[77]
Race and ethnicity
[edit]
 Map of racial distribution of the Oklahoma City area, 2020 U.S. census. Each dot is one person:
⬤ White
Map of racial distribution of the Oklahoma City area, 2020 U.S. census. Each dot is one person:
⬤ White
⬤ Black
⬤ Asian
⬤ Hispanic
⬤ Multiracial
⬤ Native American/Other
| Historical racial composition |
2020 [71] |
2010[78] |
1990[22] |
1970[22] |
1940[22] |
| White (Non-Hispanic) |
49.5% |
56.7% |
72.9% |
82.2% |
90.4% |
| Hispanic or Latino |
21.3% |
17.2% |
5.0% |
2.0% |
n/a |
| Black or African American |
13.8% |
14.8% |
16.0% |
13.7% |
9.5% |
| Mixed |
7.6% |
4.0% |
0.4% |
– |
– |
| Asian |
4.6% |
4.0% |
2.4% |
0.2% |
– |
| Native American |
3.4% |
3.1% |
4.2% |
2.0% |
0.1% |
According to the 2020 census, the racial composition of Oklahoma City was as follows:[79] White or European American 49.5%, Hispanic or Latino 21.3%, Black or African American 13.8%, Asian 4.6%, Native American 2.8%, Native Hawaiian and Other Pacific Islander 0.2%, other race 0.4%, and two or more races (non-Hispanic) 7.6%. Its population has diversified since the 1940s census, where 90.4% was non-Hispanic white.[22] An analysis in 2017 found Oklahoma City to be the 8th least racially segregated significant city in the United States.[80] Of the 20 largest US cities, Oklahoma City has the second-highest percentage of the population reporting two or more races on the Census, 7.6%, second to 8.9% in New York City.
2020
[edit]
Oklahoma City – Racial and ethnic composition
Note: the US Census treats Hispanic/Latino as an ethnic category. This table excludes Latinos from the racial categories and assigns them to a separate category. Hispanics/Latinos may be of any race.
| Race / Ethnicity (NH = Non-Hispanic) |
Pop 2000[81] |
Pop 2010[82] |
Pop 2020[83] |
% 2000 |
% 2010 |
% 2020 |
| White alone (NH) |
327,225 |
328,582 |
337,063 |
64.65% |
56.65% |
49.49% |
| Black or African American alone (NH) |
76,994 |
85,744 |
93,767 |
15.21% |
14.78% |
13.77% |
| Native American or Alaska Native alone (NH) |
16,406 |
18,208 |
18,757 |
3.24% |
3.14% |
2.75% |
| Asian alone (NH) |
17,410 |
23,051 |
31,163 |
3.44% |
3.97% |
4.58% |
| Pacific Islander alone (NH) |
278 |
464 |
971 |
0.05% |
0.08% |
0.14% |
| Some Other Race alone (NH) |
452 |
700 |
2,700 |
0.09% |
0.12% |
0.40% |
| Mixed Race or Multi-Racial (NH) |
15,999 |
23,212 |
51,872 |
3.16% |
4.00% |
7.62% |
| Hispanic or Latino (any race) |
51,368 |
100,038 |
144,761 |
10.15% |
17.25% |
21.26% |
| Total |
506,132 |
579,999 |
681,054 |
100.00% |
100.00% |
100.00% |
Metropolitan statistical area
[edit]
 Old Interstate 40 Crosstown, Oklahoma City
Oklahoma City is the principal city of the eight-county Oklahoma City metropolitan statistical Area in Central Oklahoma and is the state's largest urbanized area. As of 2015, the metro area was the 41st largest in the nation based on population.[84]
Religion
[edit]
The Association of Religion Data Archives in 2020 reported that the Southern Baptist Convention was the city and metropolitan area's most prominent Christian tradition with 213,008 members, Christianity being the area's predominant religion. Non/interdenominational Protestants were the second largest tradition with 195,158 members. The Roman Catholic Church claimed 142,491 adherents throughout the metropolitan region and Pentecostals within the Assemblies of God USA numbered 48,470.[85] The remainder of Christians in the area held to predominantly Evangelical Christian beliefs in numerous evangelical Protestant denominations. Outside of Christendom, there were 4,230 practitioners of Hinduism and 2,078 Mahayana Buddhists. An estimated 8,904 residents practiced Islam during this study.[85]
Crime
[edit]
Law enforcement claims Oklahoma City has traditionally been the territory of the notorious Juárez Cartel, but the Sinaloa Cartel has been reported as trying to establish a foothold in Oklahoma City. There are many rival gangs in Oklahoma City, one whose headquarters has been established in the city, the Southside Locos, traditionally known as Sureños.[86]
Oklahoma City also has its share of violent crimes, particularly in the 1970s. The worst occurred in 1978 when six employees of a Sirloin Stockade restaurant on the city's south side were murdered execution-style in the restaurant's freezer. An intensive investigation followed, and the three individuals involved, who also killed three others in Purcell, Oklahoma, were identified. One, Harold Stafford, died in a motorcycle accident in Tulsa not long after the restaurant murders. Another, Verna Stafford, was sentenced to life without parole after being granted a new trial after she had been sentenced to death. Roger Dale Stafford, considered the mastermind of the murder spree, was executed by lethal injection at the Oklahoma State Penitentiary in 1995.[87]
The Oklahoma City Police Department has a uniformed force of 1,169 officers and 300+ civilian employees. The department has a central police station and five substations covering 2,500 police reporting districts that average 1/4 square mile in size.
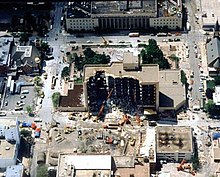 The Murrah Federal Building after the attack
On April 19, 1995, the Alfred P. Murrah Federal Building was destroyed by a fertilizer bomb manufactured and detonated by Timothy McVeigh. The blast and catastrophic collapse killed 168 people and injured over 680. The blast shock-wave destroyed or damaged 324 buildings within a 340-meter radius, destroyed or burned 86 cars, and shattered glass in 258 nearby buildings, causing at least an estimated $652 million. McVeigh was convicted and subsequently executed by lethal injection on June 11, 2001.
Economy
[edit]
See also: List of companies based in Oklahoma City
 The Sonic Drive-In restaurant chain is headquartered in Oklahoma City.
The economy of Oklahoma City, once just a regional power center of government and energy exploration, has since diversified to include the sectors of information technology, services, health services, and administration. The city is headquarters to two Fortune 500 companies: Expand Energy and Devon Energy,[88] as well as being home to Love's Travel Stops & Country Stores, which is ranked thirteenth on Forbes' list of private companies.[89]
As of March 2024, the top 20 employers in the city were:[90]
| # |
Employer |
# of employees |
| 1 |
State of Oklahoma (State Capital) |
37,600 |
| 2 |
Tinker Air Force Base |
26,000 |
| 3 |
Oklahoma State University-Stillwater |
13,940 |
| 4 |
University of Oklahoma-Norman |
11,530 |
| 5 |
Integris Health |
11,000 |
| 6 |
Amazon |
8,000 |
| 7 |
Hobby Lobby Stores (HQ) |
6,500 |
| 8 |
Mercy Health Center (HQ) |
6,500 |
| 9 |
SSM Health Care (Regional HQ) |
5,600 |
| 10 |
FAA Mike Monroney Aeronautical Center |
5,150 |
| 11 |
University of Oklahoma Health Sciences Center |
5000 |
| 12 |
City of Oklahoma City |
4,500 |
| 13 |
OU Medical Center |
4,360 |
| 14 |
Paycom (HQ) |
4,200 |
| 15 |
The Boeing Company |
3,740 |
| 16 |
Midfirst Bank (HQ) |
3,100 |
| 17 |
Norman Regional Hospital |
2,740 |
| 18 |
AT&T |
2,700 |
| 19 |
OGE Energy Corp (HQ) |
2,240 |
| 20 |
Dell |
2,100 |
Other major corporations with a significant presence (over 1,000 employees) in the city of Oklahoma City include the United Parcel Service, Farmers Insurance Group, Great Plains Coca-Cola Bottling Company, Deaconess Hospital, Johnson Controls, MidFirst Bank, Rose State College, and Continental Resources.[91][92]
While not in the city limits, other large employers within the Oklahoma City MSA include United States Air Force – Tinker AFB (27,000); University of Oklahoma (11,900); University of Central Oklahoma (2,900); and Norman Regional Hospital (2,800).[91]
According to the Oklahoma City Chamber of Commerce, the metropolitan area's economic output grew by 33% between 2001 and 2005 due chiefly to economic diversification. Its gross metropolitan product (GMP) was $43.1 billion in 2005[93] and grew to $61.1 billion in 2009.[94] By 2016 the GMP had grown to $73.8 billion.[95]
In 2008, Forbes magazine reported that the city had falling unemployment, one of the strongest housing markets in the country and solid growth in energy, agriculture, and manufacturing.[96] However, during the early 1980s, Oklahoma City had one of the worst job and housing markets due to the bankruptcy of Penn Square Bank in 1982 and then the post-1985 crash in oil prices (oil bust).[citation needed]
Tourism
[edit]
Approximately 23.2 million visitors contributed $4.3 billion to Oklahoma City's economy. These visitors directly spent $2.6 billion, sustained nearly 34,000 jobs, and generated $343 million in state and local taxes.[97]
Business districts
[edit]
See also: Neighborhoods of Oklahoma City
Business and entertainment districts (and, to a lesser extent, local neighborhoods) tend to maintain their boundaries and character by applying zoning regulations and business improvement districts (districts where property owners agree to a property tax surcharge to support additional services for the community).[98] Through zoning regulations, historic districts, and other special zoning districts, including overlay districts, are well established.[99] Oklahoma City has three business improvement districts, including one encompassing the central business district.
Culture
[edit]
Museums and theaters
[edit]
|
|
This article needs additional citations for verification. Please help improve this article by adding citations to reliable sources. Unsourced material may be challenged and removed.
Find sources: "Oklahoma City" – news · newspapers · books · scholar · JSTOR (April 2018) (Learn how and when to remove this message)
|
 Water taxis in Oklahoma City's downtown Bricktown neighborhood
The Donald W. Reynolds Visual Arts Center is the new downtown home for the Oklahoma City Museum of Art. The museum features visiting exhibits, original selections from its collection, a theater showing various foreign, independent, and classic films each week, and a restaurant. OKCMOA is also home to the most comprehensive collection of Chihuly glass in the world, including the 55-foot Eleanor Blake Kirkpatrick Memorial Tower in the Museum's atrium.[100] The art deco Civic Center Music Hall, which was renovated in 2001, has performances from the Oklahoma City Ballet, the Oklahoma City Opera, the Oklahoma City Philharmonic, and also various concerts and traveling Broadway shows.
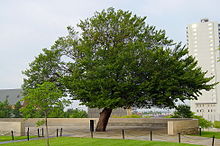 The Survivor Tree on the grounds of the Oklahoma City National Memorial
Other theaters include the Lyric Theatre, Jewel Box Theatre, Kirkpatrick Auditorium, the Poteet Theatre, the Oklahoma City Community College Bruce Owen Theater, and the 488-seat Petree Recital Hall at the Oklahoma City University campus. The university opened the Wanda L Bass School of Music and Auditorium in April 2006.
The Oklahoma Contemporary Arts Center (formerly City Arts Center) moved downtown in 2020, near Campbell Art Park at 11th and Broadway, after being at the Oklahoma State Fair fairgrounds since 1989. It features exhibitions, performances, classes, workshops, camps, and weekly programs.
The Science Museum Oklahoma (formerly Kirkpatrick Science and Air Space Museum at Omniplex) houses exhibits on science and aviation and an IMAX theater. The museum formerly housed the International Photography Hall of Fame (IPHF), which displays photographs and artifacts from an extensive collection of cameras and other artifacts preserving the history of photography. IPHF honors those who have contributed significantly to the art and/or science of photography and relocated to St. Louis, Missouri in 2013.
The Museum of Osteology displays over 450 real skeletons and houses over 7,000.[101] Focusing on the form and function of the skeletal system, this 7,000 sq ft (650 m2) museum displays hundreds of skulls and skeletons from all corners of the world. Exhibits include adaptation, locomotion, classification, and diversity of the vertebrate kingdom. The Museum of Osteology is the only one of its kind in America.
The National Cowboy & Western Heritage Museum has galleries of western art[102] and is home to the Hall of Great Western Performers.[103]
In September 2021, the First Americans Museum opened to the public, focusing on the histories and cultures of the numerous tribal nations and many Indigenous peoples in the state of Oklahoma.[104]
The Oklahoma City National Memorial in the northern part of Oklahoma City's downtown was created as the inscription on its eastern gate of the Memorial reads, "to honor the victims, survivors, rescuers, and all who were changed forever on April 19, 1995"; the memorial was built on the land formerly occupied by the Alfred P. Murrah Federal Building complex before its 1995 bombing. The outdoor Symbolic Memorial can be visited 24 hours a day for free, and the adjacent Memorial Museum, in the former Journal Record building damaged by the bombing, can be entered for a small fee. The site is also home to the National Memorial Institute for the Prevention of Terrorism, a non-partisan, nonprofit think tank devoted to preventing terrorism.
The American Banjo Museum in the Bricktown Entertainment district is dedicated to preserving and promoting the music and heritage of the banjo.[105] Its collection is valued at $3.5 million[citation needed], and an interpretive exhibit tells the evolution of the banjo from its roots in American slavery, to bluegrass, to folk, and to world music.
The Oklahoma History Center is the state's history museum. Across the street from the governor's mansion at 800 Nazih Zuhdi Drive in northeast Oklahoma City, the museum opened in 2005 and is operated by the Oklahoma Historical Society. It preserves Oklahoma's history from the prehistoric to the present day.
The Oklahoma State Firefighters Museum contains early colonial firefighting tools, the first fire station in Oklahoma,[106] and modern fire trucks.[107]
Restaurants
[edit]
Florence's Restaurant in 2022 was named one of America's Classics by the James Beard Foundation.[108][109] It was the first James Beard award for an Oklahoma entity.[108] The Oklahoman called Florence's "The Grand Dame of all local restaurants".[110] Andrew Black, chef/owner of Grey Sweater, won the 2023 James Beard Award for Best Chef Southwest.[111]
The Food Network show Diners, Drive-Ins, and Dives has been to several restaurants in the Oklahoma City metropolitan area. Some of these include Cattlemen's Steakhouse, Chick N Beer, Clanton's Cafe, The Diner, Eischen's Bar, Florence's Restaurant, and Guyutes, among several others.[112]
Sports
[edit]
Main article: Sports in Oklahoma City
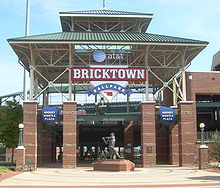 Chickasaw Bricktown Ballpark, home of the Oklahoma City Comets
Oklahoma City is home to several professional sports teams, including the Oklahoma City Thunder of the National Basketball Association. The Thunder is the city's second "permanent" major professional sports franchise after the now-defunct AFL Oklahoma Wranglers. It is the third major-league team to call the city home when considering the temporary hosting of the New Orleans/Oklahoma City Hornets for the 2005–06 and 2006–07 NBA seasons. However, the Thunder was formerly the Sonics before the movement of the Sonics to OKC in 2008.
Other professional sports clubs in Oklahoma City include the Oklahoma City Comets, the Triple-A affiliate of the Los Angeles Dodgers, the Oklahoma City Energy FC of the United Soccer League, and the Crusaders of Oklahoma Rugby Football Club of USA Rugby. The Oklahoma City Blazers, a name used for decades of the city's hockey team in the Central Hockey League, has been used for a junior team in the Western States Hockey League since 2014.
The Paycom Center in downtown is the main multipurpose arena in the city, which hosts concerts, NHL exhibition games, and many of the city's pro sports teams. In 2008, the Oklahoma City Thunder became the primary tenant. Nearby in Bricktown, the Chickasaw Bricktown Ballpark is the home to the city's baseball team, the Comets. "The Brick", as it is locally known, is considered one of the finest minor league parks in the nation.[113]
Oklahoma City hosts the World Cup of Softball and the annual NCAA Women's College World Series. The city has held 2005 NCAA Men's Basketball First and Second round and hosted the Big 12 Men's and women's basketball tournaments in 2007 and 2009. The major universities in the area – University of Oklahoma, Oklahoma City University, and Oklahoma State University – often schedule major basketball games and other sporting events at Paycom Center and Chickasaw Bricktown Ballpark. However, most home games are played at their campus stadiums.
Other major sporting events include Thoroughbred and Quarter Horse racing circuits at Remington Park and numerous horse shows and equine events that take place at the state fairgrounds each year. There are multiple golf courses and country clubs spread around the city.
[edit]
The state of Oklahoma hosts a highly competitive high school football culture, with many teams in the Oklahoma City metropolitan area. The Oklahoma Secondary School Activities Association (OSSAA) organizes high school football into eight distinct classes based on school enrollment size. Beginning with the largest, the classes are 6A, 5A, 4A, 3A, 2A, A, B, and C. Class 6A is broken into two divisions. Oklahoma City schools in include: Westmoore, Putnam City North, Putnam City, Putnam City West, Southeast, Capitol Hill, U.S. Grant, and Northwest Classen.[114]
Oklahoma City Thunder
[edit]
The Oklahoma City Thunder of the National Basketball Association (NBA) has called Oklahoma City home since the 2008–09 season, when owner Clay Bennett relocated the franchise from Seattle, Washington. The Thunder plays home games in downtown Oklahoma City at the Paycom Center. The Thunder is known by several nicknames, including "OKC Thunder" and simply "OKC", and its mascot is Rumble the Bison.
After arriving in Oklahoma City for the 2008–09 season, the Oklahoma City Thunder secured a berth (8th) in the 2010 NBA Playoffs the following year after boasting its first 50-win season, winning two games in the first round against the Los Angeles Lakers. In 2012, Oklahoma City made it to the NBA Finals but lost to the Miami Heat in five games. In 2013, the Thunder reached the Western Conference semi-finals without All-Star guard Russell Westbrook, who was injured in their first-round series against the Houston Rockets, only to lose to the Memphis Grizzlies. In 2014, Oklahoma City reached the NBA's Western Conference Finals again but eventually lost to the San Antonio Spurs in six games.
Sports analysts have regarded the Oklahoma City Thunder as one of the elite franchises of the NBA's Western Conference and a media darling of the league's future. Oklahoma City earned Northwest Division titles every year from 2011 to 2014 and again in 2016 and has consistently improved its win record to 59 wins in 2014. The Thunder is led by third-year head coach Mark Daigneault and was anchored by All-Star point guard Russell Westbrook before a July 2019 trade that sent him to the Houston Rockets.
Hornets
[edit]
Main article: Effect of Hurricane Katrina on the New Orleans Hornets
In the aftermath of Hurricane Katrina, the NBA's New Orleans Hornets temporarily relocated to the Ford Center, playing the majority of its home games there during the 2005–06 and 2006–07 seasons. The team became the first NBA franchise to play regular-season games in Oklahoma.[citation needed] The team was known as the New Orleans/Oklahoma City Hornets while playing in Oklahoma City. The team returned to New Orleans full-time for the 2007–08 season. The Hornets played their final home game in Oklahoma City during the exhibition season on October 9, 2007, against the Houston Rockets.
Professional sports teams
[edit]
Main article: Sports in Oklahoma City
Current professional sports teams
| Sports Franchise |
League |
Sport |
Founded |
Stadium (capacity) |
| Oklahoma City Thunder |
NBA |
Basketball |
2008 |
Paycom Center (18,203) |
| Oklahoma City Comets |
MiLB |
Baseball |
1998 |
Chickasaw Bricktown Ballpark (13,066) |
| Oklahoma City Blue |
NBA G League |
Basketball |
2018 |
Paycom Center (18,203) |
| Oklahoma City Energy |
USL Championship (Division 2) |
Soccer |
2018 |
Taft Stadium (7,500) |
| Oklahoma City Football Club |
Women's Premier Soccer League |
Soccer |
2022 |
Brian Harvey Field (1,500) |
| Oklahoma City Spark |
Women's Professional Fastpitch |
Softball |
2023 |
USA Softball Hall of Fame Stadium (13,500) |
2028 Olympics
[edit]
Venues in Oklahoma City will host two events during the 2028 Summer Olympics, which will primarily be held in Los Angeles. The LA Olympic Organizing Committee opted to have canoe slalom and softball in Oklahoma City, given the lack of acceptable venues for those sports in Los Angeles. Riversport OKC will host the canoe slalom competition, while Devon Park will host the softball competition. Oklahoma City is located approximately 1,300 miles away from Los Angeles.[115]
Parks and recreation
[edit]
 Myriad Botanical Gardens, the centerpiece of downtown OKC's central business district
One of the more prominent landmarks of downtown Oklahoma City is the Crystal Bridge tropical conservatory at the Myriad Botanical Gardens, a large downtown urban park. Designed by I. M. Pei, the park also includes the Water Stage amphitheater, a bandshell, and lawn, a sunken pond complete with koi, an interactive children's garden complete with a carousel and water sculpture, various trails and interactive exhibits that rotate throughout the year including the ice skating in the Christmas winter season. In 2007, following a renovation of the stage, Oklahoma Shakespeare In The Park relocated to the Myriad Gardens. Bicentennial Park, also downtown located near the Oklahoma City Civic Center campus, is home to the annual Festival of the Arts in April.
The Scissortail Park is just south of the Myriad Gardens, a large interactive park that opened in 2021. This park contains a large lake with paddleboats, a dog park, a concert stage with a great lawn, a promenade including the Skydance Bridge, a children's interactive splash park and playground, and numerous athletic facilities. Farmers Market is a common attraction at Scissortail Park during the season, and there are multiple film showings, food trucks, concerts, festivals, and civic gatherings.
Returning to the city's first parks masterplan, Oklahoma City has at least one major park in each quadrant outside downtown. Will Rogers Park, the Grand Boulevard loop once connected Lincoln Park, Trosper Park, and Woodson Park, some sections of which no longer exist. Martin Park Nature Center is a natural habitat in far northwest Oklahoma City. Will Rogers Park is home to the Lycan Conservatory, the Rose Garden, and the Butterfly Garden, all built in the WPA era. In April 2005, the Oklahoma City Skate Park at Wiley Post Park was renamed the Mat Hoffman Action Sports Park to recognize Mat Hoffman, an Oklahoma City area resident and businessman who was instrumental in the design of the skate park and is a 10-time BMX World Vert champion.[116]
Walking trails line the Bricktown Canal and the Oklahoma River in downtown. The city's bike trail system follows around Lake Hefner and Lake Overholser in the northwest and west quadrants of the city. The majority of the east shore area of Lake Hefner is taken up by parks and bike trails, including a new leashless dog park and the postwar-era Stars and Stripes Park, and eateries near the lighthouse. Lake Stanley Draper, in southeast Oklahoma City, is the city's largest and most remote lake, offering a genuine rural yet still urban experience.
The Oklahoma City Zoo and Botanical Garden is home to numerous natural habitats, WPA era architecture and landscaping, and major touring concerts during the summer at its amphitheater. Nearby is a combination racetrack and casino, Remington Park, which hosts both Quarter Horse (March – June) and Thoroughbred (August—December) seasons.
Oklahoma City is also home to the American Banjo Museum, which houses a large collection of highly decorated banjos from the early 20th century and exhibits the banjo's history and its place in American history. Concerts and lectures are also held there.
Government
[edit]
Main article: Government of Oklahoma City
See also: List of mayors of Oklahoma City
 Oklahoma State Capitol, seen from the OK History Center
 The Art Deco city hall building, a block from the Civic Center
The City of Oklahoma City has operated under a council-manager form of city government since 1927.[117] David Holt assumed the office of Mayor on April 10, 2018, after being elected two months earlier.[118] Eight councilpersons represent each of the eight wards of Oklahoma City. The City Council appointed current City Manager Craig Freeman on November 20, 2018. Freeman took office on January 2, 2018, succeeding James D. Couch, who had served in the role since 2000. Before becoming City Manager, Craig Freeman served as Finance Director for the city.[119]
Politics
[edit]
Similar to many American cities, Oklahoma City is politically conservative in its suburbs and liberal in the central city. In the United States House of Representatives, it is represented by Republicans Stephanie Bice and Tom Cole of the 5th and 4th districts, respectively. The city has called on residents to vote for sales tax-based projects to revitalize parts of the city. The Bricktown district is the best example of such an initiative. In the recent MAPS 3 vote, the city's fraternal police order criticized the project proposals for not doing enough to expand the police presence to keep up with the growing residential population and increased commercial activity. In September 2013, Oklahoma City area attorney David Slane announced he would pursue legal action regarding MAPS3 on claims the multiple projects that made up the plan violate a state constitutional law limiting voter ballot issues to a single subject.[120]
 Oklahoma City region population dot map and 2016 presidential election results by precinct (click to enlarge).
| Oklahoma County Voter Registration and Party Enrollment as of November 1, 2020[121] |
| Party |
Number of Voters |
Percentage |
| |
Democratic |
164,628 |
37.26% |
| |
Republican |
189,991 |
43.00% |
| |
Libertarian |
3,385 |
0.77% |
| |
Unaffiliated |
83,799 |
18.97% |
| Total |
441,803 |
100% |
International relations
Consulates
[edit]
| Consulate |
Date |
Consular District |
| Guatemalan Consulate-General, Oklahoma City[122] |
06.2017 |
Oklahoma, Kansas |
| Mexican Consulate, Oklahoma City[123] |
05.2023 |
Oklahoma |
| Germany Honorary Consulate, Oklahoma City |
|
|
Twin towns – sister cities
[edit]
Oklahoma City's sister cities are:[124]
 Rio de Janeiro, Brazil
 Haikou, China
 Puebla, Mexico
 Piura, Peru
 Kigali, Rwanda
 Ulyanovsk, Russia (suspended August, 2022)
 Tainan, Taiwan
- Taipei, Taiwan
 Darwin, Australia
Education
[edit]
Higher education
[edit]
See also: List of colleges and universities in Oklahoma City
 OU Health Sciences Center in Oklahoma City
The city is home to several colleges and universities. Oklahoma City University, formerly known as Epworth University, was founded by the United Methodist Church on September 1, 1904, and is known for its performing arts, science, mass communications, business, law, and athletic programs. OCU has its main campus in the north-central section of the city, near the city's Asia District area. OCU Law is in the old Central High School building in the Midtown district near downtown.
The University of Oklahoma has several institutions of higher learning in the city and metropolitan area, with OU Medicine and the University of Oklahoma Health Sciences Center campuses east of downtown in the Oklahoma Health Center district, and the main campus to the south in the suburb of Norman. OU Medical Center hosts the state's only Level-One trauma center. OU Health Sciences Center is one of the nation's largest independent medical centers, employing over 12,000 people.[125] OU is one of only four major universities in the nation to operate six medical schools.[clarification needed]
The third-largest university in the state, the University of Central Oklahoma, is just north of the city in the suburb of Edmond. Oklahoma Christian University, one of the state's private liberal arts institutions, is just south of the Edmond border, inside the Oklahoma City limits.[126]
Oklahoma City Community College in south Oklahoma City is the second-largest community college in the state. Rose State College is east of Oklahoma City in suburban Midwest City. Oklahoma State University–Oklahoma City is in the "Furniture District" on the Westside. Northeast of the city is Langston University, the state's historically black college (HBCU). Langston also has an urban campus in the eastside section of the city. Southern Nazarene University, which was founded by the Church of the Nazarene, is a university in suburban Bethany, which is surrounded by the Oklahoma City city limits.
Although technically not a university, the FAA's Mike Monroney Aeronautical Center has many aspects of an institution of higher learning. Its FAA Academy is accredited by the Higher Learning Commission. Its Civil Aerospace Medical Institute (CAMI) has a medical education division responsible for aeromedical education in general, as well as the education of aviation medical examiners in the U.S. and 93 other countries. In addition, The National Academy of Science offers Research Associateship Programs for fellowship and other grants for CAMI research.
Primary and secondary
[edit]
Main article: Education in Oklahoma City
 Bishop McGuinness Catholic High School
Oklahoma City is home to (as of 2009) the state's largest school district, Oklahoma City Public Schools,[127] which covers the most significant portion of the city.[128] The district's Classen School of Advanced Studies and Harding Charter Preparatory High School rank high among public schools nationally according to a formula that looks at the number of Advanced Placement, International Baccalaureate and/or Cambridge tests taken by the school's students divided by the number of graduating seniors.[129] In addition, OKCPS's Belle Isle Enterprise Middle School was named the top middle school in the state according to the Academic Performance Index and recently received the Blue Ribbon School Award, in 2004 and again in 2011.[130]
Due to Oklahoma City's explosive growth, parts of several suburban districts spill into the city. All but one of the school districts in Oklahoma County includes portions of Oklahoma City. The other districts in that county covering OKC include: Choctaw/Nicoma Park, Crooked Oak, Crutcho, Deer Creek, Edmond, Harrah, Jones, Luther, McLoud, Mid-Del, Millwood, Moore, Mustang, Oakdale, Piedmont, Putnam City, and Western Heights.[128] School districts in Cleveland County covering portions of Oklahoma City include: Little Axe, McLoud, Mid-Del, Moore, and Robin Hill.[131] Within Canadian County, Banner, Mustang, Piedmont, Union City, and Yukon school districts include parts of OKC.[132]
There are also charter schools. KIPP Reach College Preparatory School in Oklahoma City received the 2012 National Blue Ribbon, and its school leader, Tracy McDaniel Sr., was awarded the Terrel H. Bell Award for Outstanding Leadership.
The city also boasts several private and parochial schools. Casady School and Heritage Hall School are both examples of a private college preparatory school with rigorous academics that range among the top in Oklahoma. Providence Hall is a Protestant school. Two prominent schools of the Archdiocese of Oklahoma City include Bishop McGuinness High School and Mount Saint Mary High School. Other private schools include the Advanced Science and Technology Education Center and Crossings Christian School.
The Oklahoma School of Science and Mathematics, a school for some of the state's most gifted math and science pupils, is also in Oklahoma City.
CareerTech
[edit]
Oklahoma City has several public career and technology education schools associated with the Oklahoma Department of Career and Technology Education, the largest of which are Metro Technology Center and Francis Tuttle Technology Center.
Private career and technology education schools in Oklahoma City include Oklahoma Technology Institute, Platt College, Vatterott College, and Heritage College. The Dale Rogers Training Center is a nonprofit vocational training center for individuals with disabilities.
[edit]
See also: Media in Oklahoma City
Print
[edit]
The Oklahoman is Oklahoma City's major daily newspaper and is the most widely circulated in the state. NewsOK.com is the Oklahoman's online presence. Oklahoma Gazette is Oklahoma City's independent newsweekly, featuring such staples as local commentary, feature stories, restaurant reviews, movie listings, and music and entertainment. The Journal Record is the city's daily business newspaper, and okcBIZ is a monthly publication that covers business news affecting those who live and work in Central Oklahoma.
Numerous community and international newspapers cater to the city's ethnic mosaic, such as The Black Chronicle, headquartered in the Eastside, the OK VIETIMES and Oklahoma Chinese Times, in Asia District, and various Hispanic community publications. The Campus is the student newspaper at Oklahoma City University. Gay publications include The Gayly Oklahoman.
An upscale lifestyle publication called 405 Magazine (formerly Slice Magazine) is circulated throughout the metropolitan area.[133] In addition, there is a magazine published by Back40 Design Group called The Edmond Outlook. It contains local commentary and human interest pieces directly mailed to over 50,000 Edmond residents.
Ready Player One is set in Oklahoma City in the year 2045.
Broadcast
[edit]
Oklahoma City was home to several pioneers in radio and television broadcasting. Oklahoma City's WKY Radio was the first radio station transmitting west of the Mississippi River and the third radio station in the United States.[134] WKY received its federal license in 1921 and has continually broadcast under the same call letters since 1922. In 1928, WKY was purchased by E.K. Gaylord's Oklahoma Publishing Company and affiliated with the NBC Red Network; in 1949, WKY-TV (channel 4) went on the air and later became the first independently owned television station in the U.S. to broadcast in color.[134] In mid-2002, WKY radio was purchased outright by Citadel Broadcasting, who was bought out by Cumulus Broadcasting in 2011. The Gaylord family earlier sold WKY-TV in 1976, which has gone through a succession of owners (what is now KFOR-TV is owned by Nexstar Media Group as of October 2019).
The major U.S. broadcast television networks have affiliates in the Oklahoma City market (ranked 41st for television by Nielsen and 48th for radio by Arbitron, covering a 34-county area serving the central, north-central and west-central sections of Oklahoma); including NBC affiliate KFOR-TV (channel 4), ABC affiliate KOCO-TV (channel 5), CBS affiliate KWTV-DT (channel 9, the flagship of locally based Griffin Media), PBS station KETA-TV (channel 13, the flagship of the state-run OETA member network), Fox affiliate KOKH-TV (channel 25), independent station KOCB (channel 34), CW owned-and-operated station KAUT-TV (channel 43), MyNetworkTV affiliate KSBI-TV (channel 52), and Ion Television affiliate KOPX-TV (channel 62). The market is also home to several religious stations, including TBN owned-and-operated station KTBO-TV (channel 14) and Norman-based Daystar owned-and-operated station KOCM (channel 46).
Despite the market's geographical size, none of the English-language commercial affiliates in the Oklahoma City designated market area operate full-power satellite stations covering the far northwestern part of the state (requiring cable or satellite to view them). However, KFOR-TV, KOCO-TV, KWTV-DT, and KOKH-TV each operate low-power translators in that portion of the market. Oklahoma City is one of the few markets between Chicago and Dallas to have affiliates of two or more of the significant Spanish-language broadcast networks: Telemundo affiliate KTUZ-TV (channel 30), Woodward-based Univision/UniMás affiliate KUOK 35 (whose translator KUOK-CD, channel 36, serves the immediate Oklahoma City area), and Estrella TV affiliate KOCY-LD (channel 48). (Locally based Tyler Media Group, which owns the three stations above, also owns eight radio stations in the market, including Regional Mexican-formatted KTUZ-FM (106.7) and news–talk outlet KOKC (1520 AM).)
Infrastructure
[edit]
Fire department
[edit]
 OKCFD dive team at Lake Hefner
 OKCFD ambulance
Oklahoma City is protected by the Oklahoma City Fire Department (OKCFD), which employs 1015 paid, professional firefighters. The current Chief of Department is Richard Kelley, and the department is commanded by three Deputy Chiefs, who – along with the department chief – oversee the Operational Services, Prevention Services, and Support Services bureaus. The OKCFD operates out of 37 fire stations throughout the city in six battalions. The OKCFD operates a fire apparatus fleet of 36 engine companies (including 30 paramedic engines), 13 ladder companies, 16 brush pumper units, six water tankers, two hazardous materials units, one Technical Rescue Unit, one Air Supply Unit, six Arson Investigation Units, and one Rehabilitation Unit along with several special units. Each engine Company is staffed with a driver, an officer, and one to two firefighters, while each ladder company is staffed with a driver, an officer, and one firefighter. The minimum staffing for each shift is 213 personnel. The Oklahoma City Fire Department responds to over 70,000 emergency calls annually.[135][136][137]
Transportation
[edit]
Main article: Transportation in Oklahoma City
Highway
[edit]
Oklahoma City is an integral point on the United States Interstate Network, with three major interstate highways – Interstate 35, Interstate 40, and Interstate 44 – bisecting the city. Interstate 240 connects Interstate 40 and Interstate 44 in south Oklahoma City. At the same time, Interstate 235 spurs from Interstate 44 in north-central Oklahoma City into downtown. Interstate 44, between NW 23rd St and NW 36th St, is the busiest roadway in the city and state, with an average daily traffic count of 167,200 vehicles per day in 2018.[138]
Major state expressways through the city include Lake Hefner Parkway (SH-74), the Kilpatrick Turnpike, Airport Road (SH-152), and Broadway Extension (US-77) which continues from I-235 connecting Central Oklahoma City to Edmond. Lake Hefner Parkway runs through northwest Oklahoma City, while Airport Road runs through southwest Oklahoma City and leads to Will Rogers World Airport. The Kilpatrick Turnpike loops around north and west Oklahoma City.
Oklahoma City also has several major national and state highways within its city limits. Shields Boulevard (US-77) continues from E.K. Gaylord Boulevard in downtown Oklahoma City and runs south, eventually connecting to I-35 near the suburb of Moore, Oklahoma. Northwest Expressway (Oklahoma State Highway 3) runs from North Classen Boulevard in north-central Oklahoma City to the northwestern suburbs.
The following significant expressways traverse Oklahoma City:
- Interstate 35
- Interstate 40 (Crosstown Expressway, Stanley Draper Expressway, Tinker Diagonal, Tom Stead Memorial Highway)
- Interstate 44 (Turner Turnpike, Belle Isle Freeway, Will Rogers Expressway, H.E. Bailey Turnpike)
- Interstate 235 (Centennial Expressway) / U.S. 77 (Broadway Extension)
- Interstate 240 (Southwest Expressway)
- Lake Hefner Parkway (State Highway 74)
- Airport Road (State Highway 152)
- Kilpatrick Turnpike
Air
[edit]
Oklahoma City is served by two primary airports, Will Rogers World Airport and the much smaller Wiley Post Airport (incidentally, the two honorees died in the same plane crash in Alaska)[139] Will Rogers World Airport is the state's busiest commercial airport, with 4,341,159 passengers served in 2018, a historical record.[140]
Tinker Air Force Base, in southeast Oklahoma City, is the largest military air depot in the nation. It is a major maintenance and deployment facility for the Navy and the Air Force and the second largest military institution in the state (after Fort Sill in Lawton).
 United Airlines Embraer 170 aircraft at the East Concourse of Will Rogers World Airport
Rail and intercity bus
[edit]
Amtrak has a station downtown at the Santa Fe Depot, with daily service to Fort Worth and the nation's rail network via the Heartland Flyer. Oklahoma City once was the crossroads of several interstate passenger railroads at the Santa Fe Depot, the Union Station, and the Missouri-Kansas-Texas Railroad station.[141] But service at that level has long since been discontinued. However, several proposals to extend the current train service have been made, including a plan to expand the Heartland Flyer to Newton, Kansas, which is currently being connected through Amtrak Thruway. Freight service is provided by BNSF Railway, Union Pacific Railroad, and Stillwater Central.
Greyhound and several other intercity bus companies serve Oklahoma City at the Union Bus Station in downtown.
Public transit
[edit]
Main articles: Embark (transit authority) and Oklahoma City Streetcar
 Streetcar of the OKC Streetcar system passing the historic First United Methodist Church, in downtown
Embark (formerly Metro Transit) is the city's public transit company. The primary transfer terminal is downtown at NW 5th Street and Hudson Avenue. Embark maintains limited coverage of the city's primary street grid using a hub-and-spoke system from the main terminal, making many journeys impractical due to the relatively small number of bus routes offered and that most trips require a transfer downtown. The city has recognized transit as a significant issue for the rapidly growing and urbanizing city. It has initiated several recent studies to improve the existing bus system, starting with a plan known as the Fixed Guideway Study.[142] This study identified several potential commuter transit routes from the suburbs into downtown OKC as well as feeder-line bus and/or rail routes throughout the city.
Though Oklahoma City has no light rail or commuter rail service, city residents identified improved transit as one of their top priorities. From the fruits of the Fixed Guideway and other studies, city leaders strongly desire to incorporate urban rail transit into the region's future transportation plans. The greater Oklahoma City metropolitan transit plan identified from the Fixed Guideway Study includes a streetcar system in the downtown area, to be fed by enhanced city bus service and commuter rail from the suburbs including Edmond, Norman, and Midwest City. There is a significant push for a commuter rail line connecting downtown OKC with the eastern suburbs of Del City, Midwest City, and Tinker Air Force Base. In addition to commuter rail, a short heritage rail line that would run from Bricktown just a few blocks away from the Amtrak station to the Adventure District in northeast Oklahoma City is under reconstruction.
In December 2009, Oklahoma City voters passed MAPS 3, the $777 million (7-year, 1-cent tax) initiative. This initiative would generate funding (approx. $130 million) for the modern Oklahoma City Streetcar system in downtown Oklahoma City and the establishment of a transit hub.
On September 10, 2013, the federal government announced that Oklahoma City would receive a $13.8-million grant from the U.S. Department of Transportation's TIGER program. This was the first-ever grant for Oklahoma City for a rail-based initiative and is thought to be a turning point for city leaders who have applied for grants in the past, only to be denied continuously. It is believed the city will use the TIGER grant along with approximately $10 million from the MAPS 3 Transit budget to revitalize the city's Amtrak station, becoming an Intermodal Transportation Hub, taking over the role of the existing transit hub at NW 5th/Hudson Ave.[citation needed]
Construction of the Oklahoma City Streetcar system in Downtown OKC began in early 2017,[143] and the system opened for service in December 2018.[144][145] Also known as the Maps 3 Streetcar, it connects the areas of Bricktown, Midtown and Downtown. The 6.9 mi (11.1 km) system serves the greater Downtown area using modern low-floor streetcars. The initial system consists of two lines connecting Oklahoma City's Central Business District with the entertainment district, Bricktown, and the Midtown District. Expansion to other districts surrounding downtown and more routes in the CBD is already underway.[citation needed]
Walkability
[edit]
A 2013 study by Walk Score ranked Oklahoma City the 43rd most walkable out of the 50 largest U.S. cities. Oklahoma City has 18 neighborhoods with a Walk Score above 60, mainly close to the downtown core.[146]
Health
[edit]
 OU Physicians Center
Oklahoma City and the surrounding metropolitan area have several healthcare facilities and specialty hospitals. In Oklahoma City's MidTown district near downtown resides the state's oldest and largest single-site hospital, St. Anthony Hospital and Physicians Medical Center.
OU Medicine, an academic medical institution on the campus of The University of Oklahoma Health Sciences Center, is home to OU Medical Center. OU Medicine operates Oklahoma's only level-one trauma center at the OU Medical Center and the state's only level-one trauma center for children at Children's Hospital at OU Medicine,[147] both of which are in the Oklahoma Health Center district. Other medical facilities operated by OU Medicine include OU Physicians and OU Children's Physicians, the OU College of Medicine, the Oklahoma Cancer Center, and OU Medical Center Edmond, the latter in the northern suburb of Edmond.
 INTEGRIS Baptist Medical Center
INTEGRIS Health owns several hospitals, including INTEGRIS Baptist Medical Center, the INTEGRIS Cancer Institute of Oklahoma,[148] and the INTEGRIS Southwest Medical Center.[149] INTEGRIS Health operates hospitals, rehabilitation centers, physician clinics, mental health facilities, independent living centers, and home health agencies throughout much of Oklahoma. INTEGRIS Baptist Medical Center ranks high-performing in the following categories: Cardiology and Heart Surgery; Diabetes and Endocrinology; Ear, Nose and Throat; Gastroenterology; Geriatrics; Nephrology; Orthopedics; Pulmonology and Urology.
The Midwest Regional Medical Center is in the suburb of Midwest City; other significant hospitals include the Oklahoma Heart Hospital and the Mercy Health Center. There are 347 physicians for every 100,000 people in the city.
In the American College of Sports Medicine's annual ranking of the United States' 50 most populous metropolitan areas on the basis of community health, Oklahoma City took last place in 2010, falling five spots from its 2009 rank of 45.[150] The ACSM's report, published as part of its American Fitness Index program, cited, among other things, the poor diet of residents, low levels of physical fitness, higher incidences of obesity, diabetes, and cardiovascular disease than the national average, low access to recreational facilities like swimming pools and baseball diamonds, the paucity of parks and low investment by the city in their development, the high percentage of households below the poverty level, and the lack of state-mandated physical education curriculum as contributing factors.[151]
Notable people
[edit]
For a more comprehensive list, see List of people from Oklahoma City.
See also
[edit]
- Coyle v. Smith
- History of Oklahoma
- List of mayors of Oklahoma City
- USS Oklahoma City, 2 ships
Notes
[edit]
- ^ Mean monthly maxima and minima (i.e. the expected highest and lowest temperature readings at any point during the year or given month) calculated based on data at said location from 1991 to 2020.
- ^ Official records for Oklahoma City were kept at the Weather Bureau Office from November 1890 to December 1953, and at Will Rogers World Airport since January 1954. For more information, see Threadex
References
[edit]
- ^
Lackmeyer, Steve (December 24, 2019). "Why Oklahoma City as 'The Big Friendly' lacks a friendly embrace". Retrieved August 29, 2023.
- ^ U.S. City Monikers, Tagline Guru website, accessed January 5, 2008
- ^ a b "Oklahoma City". Oklahoma History Society. Archived from the original on April 2, 2016. Retrieved April 12, 2016.
- ^ "ArcGIS REST Services Directory". United States Census Bureau. Retrieved September 20, 2022.
- ^ a b U.S. Geological Survey Geographic Names Information System: Oklahoma City
- ^ "2020 Population and Housing State Data". United States Census Bureau. Retrieved August 22, 2021.
- ^ "Total Gross Domestic Product for Oklahoma City, OK (MSA)". fred.stlouisfed.org.
- ^ "Zip Code Lookup". USPS. Archived from the original on November 4, 2010. Retrieved December 11, 2008.
- ^ "Find a County". National Association of Counties. Archived from the original on May 31, 2011. Retrieved June 7, 2011.
- ^ "U.S. Census Bureau QuickFacts: Oklahoma City city, Oklahoma".
- ^ a b "Metropolitan and Micropolitan Statistical Areas". 2018 Population Estimates. United States Census Bureau, Population Division. April 15, 2019. Retrieved April 18, 2019. [permanent dead link]
- ^ "Stockyards City | Oklahoma City Districts". Visitokc.com.
- ^ Shariat, Sheryll; Mallonee, Sue; Stidham, Shelli Stephens (December 1998). Oklahoma City Bombing Injuries (PDF) (Report). Injury Prevention Service, Oklahoma State Department of Health. pp. 2–3. Retrieved October 21, 2024.
- ^ a b "Tornadoes Which Have Occurred in the Oklahoma City, Oklahoma Area Since 1890". National Weather Service Norman Oklahoma. Archived from the original on February 17, 2017. Retrieved December 8, 2015.
- ^ (2009) Kansas Historical Society, Ioway-Otoe-Missouria Language Project, English to Ioway-Otoe-Missouria Dictionary, "Dictionary N-O (English to Baxoje)", "Oklahoma City, Okla.". Link
- ^ Gordon Whittaker, 2005, "A Concise Dictionary of the Sauk Language", The Sac & Fox National Public Library Stroud, Oklahoma. [1]
- ^ Hoig, Stan. "Land Run of 1889". Encyclopedia of Oklahoma History & Culture. Oklahoma Historical Society. Archived from the original on February 21, 2014. Retrieved January 29, 2014.
- ^ Wilson, Linda D. "Oklahoma City", Archived May 25, 2011, at the Wayback Machine, Encyclopedia of Oklahoma History and Culture Archived February 1, 2015, at the Wayback Machine. Retrieved January 26, 2010.
- ^ Wilson. Encyclopedia of Oklahoma History and Culture Archived February 1, 2015, at the Wayback Machine
- ^ Curtis, Gene. "Only in Oklahoma: State capital location was a fight to the finish", Tulsa World. Retrieved February 4, 2010.
- ^ "Oklahoma Oil: Past, Present and Future" (PDF). Ogs.ou.edu.
- ^ a b c d e "Race and Hispanic Origin for Selected Cities and Other Places: Earliest Census to 1990". U.S. Census Bureau. Archived from the original on August 12, 2012.
- ^ Smallwood, James M. (1977). "Mr. Oklahoma City". Urban Builder : Life and Times of Stanley Draper. University of Oklahoma Press. pp. 197–198. ISBN 0-8061-1447-9.
- ^ a b Dean, Bryan (December 28, 2012). "Former Oklahoma City Mayor Patience Latting dies at age 94". The Oklahoman. Retrieved January 11, 2013.
- ^ "Criterion Group". OKCHistory.com. Archived from the original on October 7, 2011. Retrieved October 20, 2009.
- ^ "The Criterion Group, main page". The Criterion Group. Archived from the original on October 29, 2009. Retrieved October 20, 2009.
- ^ "Baum Building". OKCHistory.org. Archived from the original on July 7, 2009. Retrieved October 20, 2009.
- ^ "Hales Building". OKCHistory.org. Archived from the original on July 7, 2009. Retrieved October 21, 2009.
- ^ Lackmeyer and Money, pp. 20, 42.
- ^ "Biltmore Hotel". OKCHistory.org. Archived from the original on July 25, 2009. Retrieved October 20, 2009.
- ^ Metropolitan Area Projects, Greater Oklahoma City Chamber. Retrieved February 5, 2010.
- ^ "Victims of the Oklahoma City bombing". USA Today. Associated Press. June 20, 2001. Archived from the original on February 15, 2012.
- ^ "Oklahoma City National Memorial". National Park Service. Archived from the original on May 14, 2011.
- ^ "Core to Shore at City of Oklahoma City". Okc.gov. Archived from the original on May 27, 2010.
- ^ "About Oklahoma City". okc.gov. Archived from the original on February 23, 2016. Retrieved February 25, 2016.
- ^ Oklahoma Geography, NetState.com . Retrieved February 4, 2010.
- ^ "Ecoregions of Oklahoma" (PDF). Retrieved September 24, 2008. [permanent dead link]
- ^ History of the Oklahoma City Zoo Archived January 17, 2016, at the Wayback Machine, Oklahoma City Life Web site. Retrieved February 5, 2010.
- ^ Elmias Thomas Collection Projects Series Archived November 15, 2014, at the Wayback Machine, University of Oklahoma. Retrieved February 5, 2010.
- ^ 2008 Oklahoma River [permanent dead link], City of Oklahoma City. Retrieved February 4, 2010. [dead link]
- ^ American Fact Finder Table GCT-PH1 retrieved on July 17, 2008
- ^ About Archived May 16, 2009, at the Wayback Machine, Modern Transit Project. Retrieved February 5, 2010.
- ^ "Devon Energy Center, Oklahoma City". SkyscraperPage.com. Retrieved February 16, 2022.
- ^ "Cotter Ranch Tower, Oklahoma City". SkyscraperPage.com. Retrieved February 16, 2022.
- ^ "First National Center, Oklahoma City". SkyscraperPage.com. Retrieved February 16, 2022.
- ^ "BOK Park Plaza, Oklahoma City". SkyscraperPage.com. Retrieved February 16, 2022.
- ^ "First Oklahoma Tower, Oklahoma City". SkyscraperPage.com. Retrieved February 16, 2022.
- ^ "Strata Tower, Oklahoma City". SkyscraperPage.com. Retrieved February 16, 2022.
- ^ "City Place, Oklahoma City". SkyscraperPage.com. Retrieved February 16, 2022.
- ^ "Valliance Bank Tower, Oklahoma City". SkyscraperPage.com. Retrieved February 16, 2022.
- ^ "One Leadership Square, Oklahoma City". SkyscraperPage.com. Retrieved February 16, 2022.
- ^ "Bank of Oklahoma Plaza, Oklahoma City". SkyscraperPage.com. Retrieved February 16, 2022.
- ^ "Scissortail Park | City of OKC". Okc.gov.
- ^ "Climatological averages and records" NWS Norman, Oklahoma. Retrieved August 22, 2012.
- ^ a b c "NowData − NOAA Online Weather Data". National Oceanic and Atmospheric Administration. Retrieved May 31, 2021.
- ^ Miller, Brandon (February 16, 2021). "These US cities had the coldest morning in decades -- with some reaching all-time record lows". CNN. Retrieved February 16, 2021.
- ^ NOAA (2013). "Regional Climate Trends and Scenarios for the U.S. National Climate Assessment" (PDF). p. 58.
- ^ "The Great Plains Tornado Outbreak of May 3–4, 1999". National Weather Service Norman Oklahoma. Retrieved May 30, 2013.
- ^ "The Tornado Outbreak of May 20, 2013". National Weather Service Norman, Oklahoma. 2013. Retrieved May 30, 2013.
- ^ "The May 31 – June 1, 2013 Tornado and Flash Flooding Event". National Weather Service Norman, Oklahoma. 2013. Retrieved June 10, 2013.
- ^ "After massive storms in Oklahoma and Texas, at least nine killed and 30 people missing". Washington Post. May 26, 2015.
- ^ "Station Name: OK OKLAHOMA CITY WILL ROGERS AP". U.S. Climate Normals 2020: U.S. Monthly Climate Normals (1991−2020). National Oceanic and Atmospheric Administration. Archived from the original on February 4, 2024. Retrieved May 31, 2021.
- ^ "WMO Climate Normals for OKLAHOMA CITY/WSFO AP OK 1961–1990". National Oceanic and Atmospheric Administration. Archived from the original on February 4, 2024. Retrieved March 11, 2014.
- ^ "Oklahoma City, Oklahoma, USA – Monthly weather forecast and Climate data". Weather Atlas. Retrieved January 28, 2019.
- ^ "Annual Estimates of the Resident Population for Counties: April 1, 2020 to July 1, 2023". United States Census Bureau. Retrieved May 16, 2024.
- ^ "U.S. Decennial Census". United States Census Bureau. Retrieved February 21, 2015.
- ^ "Historical Census Browser". University of Virginia Library. Archived from the original on August 11, 2012. Retrieved February 21, 2015.
- ^ Forstall, Richard L., ed. (March 27, 1995). "Population of Counties by Decennial Census: 1900 to 1990". United States Census Bureau. Retrieved February 21, 2015.
- ^ "Census 2000 PHC-T-4. Ranking Tables for Counties: 1990 and 2000" (PDF). United States Census Bureau. April 2, 2001. Archived (PDF) from the original on October 9, 2022. Retrieved February 21, 2016.
- ^ "State & County QuickFacts". United States Census Bureau. Archived from the original on June 6, 2011. Retrieved November 12, 2013.
- ^ a b Indianapolis Star (October 21, 2014). "Oklahoma City city, Oklahoma Demographics and Housing 2020 Decennial Census | indystar.com". Data.indystar.com. Retrieved February 16, 2022.
- ^ "Oklahoma 2010: Summary Population and Housing Statistics" (PDF). Census.gov. Retrieved March 15, 2020.
- ^ Data Access and Dissemination Systems (DADS). "American FactFinder – Results". Census.gov. Archived from the original on February 12, 2020.
- ^ U.S. Census Bureau. "Income in the Past 12 Months (in 2022 Inflation-Adjusted Dollars)." American Community Survey, ACS 1-Year Estimates Subject Tables, Table S1901, 2022, https://data.census.gov/table/ACSST1Y2022.S1901?t=Income and Poverty&g=160XX00US4055000. Accessed on May 1, 2024.
- ^ U.S. Census Bureau. "Per Capita Income in the Past 12 Months (in 2022 Inflation-Adjusted Dollars)." American Community Survey, ACS 1-Year Estimates Detailed Tables, Table B19301, 2022, https://data.census.gov/table/ACSDT1Y2022.B19301?t=Income and Poverty&g=160XX00US4055000. Accessed on May 1, 2024.
- ^ U.S. Census Bureau. "Poverty Status in the Past 12 Months." American Community Survey, ACS 1-Year Estimates Subject Tables, Table S1701, 2022, https://data.census.gov/table/ACSST1Y2022.S1701?t=Income and Poverty&g=160XX00US4055000. Accessed on May 1, 2024.
- ^ U.S. Census Bureau. "COUPLED HOUSEHOLDS, BY TYPE." Decennial Census, DEC Demographic and Housing Characteristics, Table PCT15, 2020, https://data.census.gov/table/DECENNIALDHC2020.PCT15?q=Oklahoma City city, Oklahoma&t=Relationship. Accessed on April 30, 2024.
- ^ "State & County QuickFacts – Oklahoma City (city), Oklahoma". United States Census Bureau. Archived from the original on March 28, 2009.
- ^ "Hispanic or Latino, and Not Hispanic or Latino By Race". data.census.gov. United States Census Bureau. August 12, 2021. Retrieved February 12, 2022.
- ^ "10 Least Segregated Cities In America".
- ^ "P004 Hispanic or Latino, and Not Hispanic or Latino by Race – 2000: DEC Summary File 1 – Oklahoma City". United States Census Bureau.
- ^ "P2 Hispanic or Latino, and not Hispanic or Latino by Race – 2010: DEC Redistricting Data (PL 94-171) – Oklahoma City". United States Census Bureau.
- ^ "P2 Hispanic or Latino, and not Hispanic or Latino by Race – 2020: DEC Redistricting Data (PL 94-171) – Oklahoma City". United States Census Bureau.
- ^ "Results". American Factfinder. United States Census Bureau. Retrieved March 24, 2016. [permanent dead link]
- ^ a b "Maps and data files for 2020 | U.S. Religion Census | Religious Statistics & Demographics". www.usreligioncensus.org. Retrieved January 24, 2023.
- ^ "Narcotics agents arrest suspected cartel member in Oklahoma City". Newsok.com. June 29, 2010. Archived from the original on May 15, 2012. Retrieved February 15, 2012.
- ^ Stover, Jean (2009). Sirloin Stockade Slaughter: Murder on the Run. Durham, Connecticut: Eloquent Books. ISBN 978-1-60860-924-6.
- ^ "Fortune 500 2014:Devon Energy Corporation". Forbes. Archived from the original on November 29, 2014. Retrieved November 29, 2014.
- ^ "Love's Travel Stops & Country Stores". Forbes. October 2014. Archived from the original on October 19, 2014. Retrieved November 29, 2014.
- ^ "Greater Oklahoma City Economic Development | Greater Oklahoma City Economic Development". www.greateroklahomacity.com. Archived from the original on April 19, 2024. Retrieved April 19, 2024.
- ^ a b "Oklahoma City MSA Major Employer List". Greater Oklahoma City. July 2014. Archived from the original on November 29, 2014. Retrieved November 29, 2014.
- ^ "Oklahoma City: Economy, City-Data.com. Retrieved January 26, 2010.
- ^ Monies, Paul (August 2, 2007). "City area enjoys increase in jobs". NewsOK. Archived from the original on September 26, 2012. Retrieved May 1, 2010.
- ^ "Gross Domestic Product by Metropolitan Area, 2016". BEA. Archived from the original on July 27, 2018.
- ^ "U.S. Metro Economies - Analysis: Metro Economies since 2009 - GMP and Employment Report: 2015-2017" (PDF). United States Conference of Mayors. IHS Global Insight. Archived from the original (PDF) on September 18, 2016. Retrieved October 2, 2016.
- ^ Zumbrun, Joshua (April 29, 2008). "America's Recession-Proof Cities". Forbes. Archived from the original on June 10, 2023.
- ^ "OKC Tourism Study Reveals Record-breaking Economic Impact". Visit OKC. August 9, 2023. Archived from the original on November 7, 2023.
- ^ "Business Improvement Districts". The City of Oklahoma City. Archived from the original on December 18, 2014. Retrieved November 29, 2014.
- ^ "Special Zoning District Map" (PDF). City of Oklahoma City. Archived from the original (PDF) on December 18, 2014. Retrieved November 29, 2014.
- ^ "Dale Chihuly: The Exhibition | Oklahoma City Museum of Art". Archived from the original on April 5, 2008.
- ^ Hayes, Jana (May 11, 2023). "Indiana Bones, Oklahoma Museum of Osteology's cat, now a TikTok celeb". The Oklahoman. Retrieved January 28, 2024.
- ^ "National Cowboy and Western Heritage Museum Reviews". U.S. News Travel. January 1, 1970. Retrieved January 28, 2024.
- ^ Smith, Cory (April 11, 2022). "Kurt Russell in Oklahoma for induction in Hall of Great Western Performers". KOKH. Retrieved January 28, 2024.
- ^ Rieger, Andy (March 4, 2014). "A New Museum for First Americans". The National Endowment for the Humanities. Retrieved January 28, 2024.
- ^ Tonkins, Sam (February 6, 2019). "American Banjo Museum in OKC provides visitors with history, artistic insight". OU Daily. Retrieved January 28, 2024.
- ^ Bond, Carol Mowdy (February 6, 2015). "Oklahoma Magazine". Oklahoma. Retrieved January 28, 2024.
- ^ Painter, Bryan (September 6, 2009). "Oklahoma City museum honors firefighters' valor". The Oklahoman. Retrieved January 28, 2024.
- ^ a b Castrodale, Jelisa (February 17, 2022). "The James Beard Foundation Just Named These Restaurants 'America's Classics'". Food & Wine. Archived from the original on February 26, 2023. Retrieved February 27, 2023.
- ^ Watts, James D. Jr (February 24, 2022). "Tulsa chefs, restaurants and bars up for James Beard Awards". Tulsa World. Retrieved February 27, 2023.
- ^ Williams, JaNae (February 25, 2023). "32 Black-owned food businesses in the OKC metro area that will have you coming back for more". The Oklahoman. Retrieved February 27, 2023.
- ^ Brown, Forrest; Hunter, Marnie (June 6, 2023). "These chefs and restaurants are 2023's James Beard Award winners". CNN. Retrieved June 6, 2023.
- ^ Martichoux, Alix (November 25, 2023). "Guy Fieri loved these Oklahoma spots on 'Diners, Drive-Ins and Dives.' How many have you tried?". Yahoo. Archived from the original on July 9, 2024. Retrieved July 9, 2024.
- ^ Michael Davis in Chickasaw Bricktown Ballpark-Oklahoma City Dodgers 29 September 2019
- ^ "Archived copy" (PDF). Archived from the original (PDF) on August 6, 2015. Retrieved September 1, 2015.
cite web: CS1 maint: archived copy as title (link)
- ^ "Oklahoma City to host softball, canoe slalom during the 2028 Los Angeles Games". NBC News. June 22, 2024. Retrieved August 11, 2024.
- ^ Couch, James D. "Council Agenda Item No. VIII. I. April 26, 2005" (PDF). Memorandum. The City of Oklahoma City. Archived from the original (PDF) on October 29, 2013. Retrieved July 23, 2012.
- ^ "Mayor and Council", Archived February 1, 2015, at the Wayback Machine" City of Oklahoma City. Retrieved January 27, 2010.
- ^ "About Mayor Holt". City of Oklahoma City. April 10, 2018. Archived from the original on April 11, 2018. Retrieved April 10, 2018.
- ^ "Craig Freeman sworn in as Oklahoma City Manager. News Releases | City of OKC". Okc.gov. January 2, 2019. Retrieved January 16, 2019.
- ^ Oklahoma City responds to David Slane's challenge of MAPS-3, KOKH-TV, September 3, 2013.
- ^ "Voter registration as of November 1, 2020 by county" (PDF). Archived from the original (PDF) on December 13, 2020. Retrieved December 14, 2020.
- ^ "Guatemala opens consulate in Oklahoma to serve a growing population". The Oklahoman. June 20, 2017.
- ^ "New consulate in Oklahoma City will serve 'vibrant Mexican community' in Oklahoma". The Oklahoman. May 22, 2023.
- ^ "Our Cities". sistercitiesokc.org. Sister Cities OKC, Inc. Retrieved May 6, 2021.
- ^ "ä¸Â国赌城最佳在线-ä¸Â国在线赌城-ä¸Â国赌城亚洲在线". Oumedical.com. Archived from the original on September 24, 2001.
- ^ "University Profile". Oc.edu.
- ^ "(OKC) District's enrollment growth a tale of demographic shifts". Daily Oklahoman. November 6, 2009. Archived from the original (ASP) on June 14, 2011. Retrieved November 6, 2009.
- ^ a b "2020 CENSUS - SCHOOL DISTRICT REFERENCE MAP: Oklahoma County, OK" (PDF). U.S. Census Bureau. Retrieved January 28, 2024.
- ^ The Top of the Class 2008, Newsweek, May 17, 2008. (Retrieved April 28, 2010).
- ^ Belle Isle Enterprise Middle School (Retrieved January 26, 2010). Archived September 5, 2008, at the Wayback Machine
- ^ "2020 CENSUS - SCHOOL DISTRICT REFERENCE MAP: Cleveland County, OK" (PDF). U.S. Census Bureau. Retrieved January 28, 2024. - Text list
- ^ "2020 CENSUS - SCHOOL DISTRICT REFERENCE MAP: Canadian County, OK" (PDF). U.S. Census Bureau. pp. 4, 7–8, 11-12 (PDF p. 5, 8–9, 12-13/13). Retrieved January 28, 2024. - Text list
- ^ "About 405 Magazine". 405 Magazine. Retrieved March 15, 2020.
- ^ a b Oklahoma Fast Facts and Trivia Archived April 21, 2009, at the Wayback Machine. Retrieved January 26, 2009.
- ^ City of Oklahoma City | Fire Department. Okc.gov. Retrieved on July 21, 2013.
- ^ City of Oklahoma City | Fire Department Archived May 26, 2013, at the Wayback Machine. Okc.gov. Retrieved on July 21, 2013.
- ^ "Archived copy" (PDF). Archived from the original (PDF) on November 13, 2013. Retrieved July 12, 2013.
cite web: CS1 maint: archived copy as title (link)
- ^ "Metro Areas" (PDF). odot.org. 2018.
- ^ "Wiley Post", Archived October 8, 2012, at the Wayback Machine, U.S. Centennial of Flight Commission. Retrieved February 1, 2010.
- ^ Current Statistics, Will Rogers World Airport . Retrieved January 12, 2018.
- ^ 'Official Guide of the Railways,' 1949 Index of Stations
- ^ Oklahoma Fixed Guideway Study Archived June 5, 2010, at the Wayback Machine (Retrieved April 21, 2010)
- ^ Crum, William (February 8, 2017). "Streetcar work begins in Bricktown". The Oklahoman. Retrieved February 8, 2017.[permanent dead link]
- ^ Crum, William (December 14, 2018). "Lines form to catch first rides on the Oklahoma City streetcar". The Oklahoman. GateHouse Media Inc. Retrieved December 14, 2018.
- ^ "OKC Streetcar service begins" (Press release). City of Oklahoma City. December 14, 2018. Retrieved December 14, 2018.
- ^ "2011 City and Neighborhood Rankings". Walk Score. 2011. Retrieved August 28, 2011.
- ^ "Trauma Centers". American College of Surgeons. Archived from the original on July 7, 2014. Retrieved September 16, 2013.
- ^ INTEGRIS Cancer Institute of Oklahoma.
- ^ Stogner, Todd. "Oklahoma Hospital, Health Center & Clinic Locations – INTEGRIS OK". Integrisok.com.
- ^ "ACSM American Fitness Index Ranks 50 Largest Metro Areas on Health And Community Fitness". ACSM. May 26, 2009. Archived from the original on July 5, 2010. Retrieved May 26, 2010.
- ^ "Oklahoma City, OK MSA 2010 AFI Report" (PDF). AFI. Archived from the original (PDF) on August 15, 2011. Retrieved May 26, 2010.
External links
[edit]
Wikimedia Commons has media related to Oklahoma City.
Oklahoma City, Oklahoma at Wikipedia's sister projects
 Definitions from Wiktionary
 Media from Commons
 News from Wikinews
 Quotations from Wikiquote
 Texts from Wikisource
 Textbooks from Wikibooks
 Resources from Wikiversity
 Travel information from Wikivoyage
- Official city website
- Oklahoma City tourism information
- Convention & Visitors' Bureau
- City-Data page
- Oklahoma City Historic Film Row District website Archived March 11, 2018, at the Wayback Machine
- New York Times travel article about Oklahoma City
- OKC.NET cultural commentary about Oklahoma City
- Voices of Oklahoma interview with Ron Norick Archived April 25, 2010, at the Wayback Machine, mayor during the Oklahoma City bombing
City of Oklahoma City
| |
- Bombing
- Climate
- Education
- Government
- People
- History
- Timeline
- Mayors
- Media
- Transportation
|
| Districts |
- Adventure District
- Asia District
- Capitol Hill
- Downtown
- Eastside
- Midtown
- Paseo
- 39th Street
- Uptown
- Western Avenue
|
| Professional sports teams |
- Oklahoma City Thunder
- Oklahoma City Blue
- Oklahoma City Comets
- Oklahoma City Energy FC
- Oklahoma City Spark
|
 Category Category- Metro area
- State of Oklahoma
|
|
Articles relating to Oklahoma City
|
|
|
Municipalities of the Greater Oklahoma City metropolitan area
| |
| Population over 500,000 |
|
| Population over 100,000 |
|
| Population over 50,000 |
- Edmond
- Midwest City
- Moore
|
| Population over 20,000 |
- Bethany
- Del City
- Mustang
- Shawnee
- Yukon
|
| Population over 10,000 |
- Chickasha
- Choctaw
- El Reno
- Guthrie
- Newcastle
- Warr Acres
|
| Population over 5,000 |
- Blanchard
- Harrah
- Noble
- Piedmont
- Purcell
- Tecumseh
- Tuttle
- The Village
|
| Population over 2,000 |
- Bethel Acres
- Chandler
- Goldsby
- Jones
- Lexington
- McLoud
- Nichols Hills
- Nicoma Park
- Pink
- Prague
- Slaughterville
- Spencer
- Stroud
|
| Population over 1,000 |
- Crescent
- Forest Park
- Langston
- Luther
- Maud
- Meeker
- Minco
- Ninnekah
- Okarche
- Rush Springs
- Union City
|
| Population over 500 |
- Carney
- Cashion
- Cole
- Davenport
- Dibble
- Earlsboro
- Valley Brook
- Verden
- Washington
- Wayne
- Wellston
|
| Population over 200 |
- Alex
- Agra
- Amber
- Asher
- Bridge Creek
- Byars
- Calumet
- Cedar Valley
- Coyle
- Johnson
- Marshall
- Mulhall
- Tribbey
- Tryon
- Wanette
|
| Population under 200 |
- Arcadia
- Bradley
- Brooksville
- Cimarron City
- Etowah
- Fallis
- Kendrick
- Lake Aluma
- Macomb
- Meridian
- Norge
- Orlando
- Pocasset
- Rosedale
- Smith Village
- Sparks
- St. Louis
- Warwick
- Woodlawn Park
|
| Counties |
- Canadian
- Cleveland
- Grady
- Logan
- Lincoln
- McClain
- Oklahoma
- Pottawatomie
|
| Metropolitan planning organization |
- Association of Central Oklahoma Governments
|
Skyscrapers in Oklahoma City
| |
| Current |
- Devon Energy Center
- BancFirst Tower
- First National Center
- City Place
- Oklahoma Tower
- BOK Park Plaza
- Strata Tower
- Valliance Bank Tower
- Bank of Oklahoma Plaza
- Leadership Square
- Regency Tower
- Founders Tower
- Mid America Tower
- Union Plaza
- The Classen
- Dowell Center
- 101 Park Avenue Building
- 100 Park Avenue Building
- Colcord Hotel
- 50 Penn Place
- Skirvin Hilton Hotel
- Oklahoma County Courthouse
|
| See also |
- List of tallest buildings in Oklahoma City
|
Municipalities and communities of Canadian County, Oklahoma, United States
| |
|
County seat: El Reno
|
| Cities |
- El Reno
- Geary‡
- Mustang
- Oklahoma City‡
- Piedmont‡
- Yukon
|
 Canadian County map
|
| Towns |
- Calumet
- Okarche‡
- Union City
|
| CDP |
|
Other
communities |
|
| Footnotes |
‡This populated place also has portions in an adjacent county or counties
|
- Oklahoma portal
- United States portal
|
Municipalities and communities of Cleveland County, Oklahoma, United States
| |
|
County seat: Norman
|
| Cities |
- Lexington
- Moore
- Noble
- Norman
- Oklahoma City‡
- Purcell‡
|
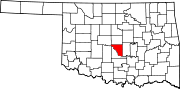 Cleveland County map
|
| Towns |
|
| Neighborhood |
|
| Footnotes |
‡This populated place also has portions in an adjacent county or counties
|
- Oklahoma portal
- United States portal
|
Municipalities and communities of Oklahoma County, Oklahoma, United States
| |
|
County seat: Oklahoma City
|
| Cities |
- Bethany
- Choctaw
- Del City
- Edmond
- Harrah
- Midwest City
- Nichols Hills
- Nicoma Park
- Oklahoma City‡
- Spencer
- The Village
- Warr Acres
|
 Oklahoma County map
|
| Towns |
- Arcadia
- Forest Park
- Jones
- Lake Aluma
- Luther
- Smith Village
- Valley Brook
- Woodlawn Park
|
Unincorporated
communities |
- Britton
- Crutcho
- Newalla
- Wheatland
|
| Footnotes |
‡This populated place also has portions in an adjacent county or counties
|
- Oklahoma portal
- United States portal
|
Municipalities and communities of Pottawatomie County, Oklahoma, United States
| |
|
County seat: Shawnee
|
| Cities |
- Maud‡
- Oklahoma City‡
- Shawnee
- Tecumseh
|
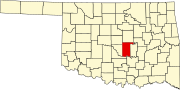 Pottawatomie County map
|
| Towns |
- Asher
- Bethel Acres
- Brooksville
- Earlsboro
- Johnson
- Macomb
- McLoud
- Pink
- St. Louis
- Tribbey
- Wanette
|
| CDP |
|
Other
communities |
- Aydelotte
- Bellemont
- Centerview
- Garden Grove
- Harjo
- Pearson
- Romulus
- Sacred Heart
- Trousdale
|
| Ghost towns |
|
| Footnotes |
‡This populated place also has portions in an adjacent county or counties
|
- Oklahoma portal
- United States portal
|
Capitals of the United States by jurisdiction
| |
Nation:
States:
- AL Montgomery
- AK Juneau
- AZ Phoenix
- AR Little Rock
- CA Sacramento
- CO Denver
- CT Hartford
- DE Dover
- FL Tallahassee
- GA Atlanta
- HI Honolulu
- ID Boise
- IL Springfield
- IN Indianapolis
- IA Des Moines
- KS Topeka
- KY Frankfort
- LA Baton Rouge
- ME Augusta
- MD Annapolis
- MA Boston
- MI Lansing
- MN Saint Paul
- MS Jackson
- MO Jefferson City
- MT Helena
- NE Lincoln
- NV Carson City
- NH Concord
- NJ Trenton
- NM Santa Fe
- NY Albany
- NC Raleigh
- ND Bismarck
- OH Columbus
- OK Oklahoma City
- OR Salem
- PA Harrisburg
- RI Providence
- SC Columbia
- SD Pierre
- TN Nashville
- TX Austin
- UT Salt Lake City
- VT Montpelier
- VA Richmond
- WA Olympia
- WV Charleston
- WI Madison
- WY Cheyenne
Territories:
- AS Pago Pago
- GU Hagåtña
- MP Saipan
- PR San Juan
- VI Charlotte Amalie
|
County seats in Oklahoma
| |
- Ada
- Altus
- Alva
- Anadarko
- Antlers
- Arapaho
- Ardmore
- Arnett
- Atoka
- Bartlesville
- Beaver
- Boise City
- Buffalo
- Chandler
- Cherokee
- Cheyenne
- Chickasha
- Claremore
- Coalgate
- Duncan
- Durant
- El Reno
- Enid
- Eufaula
- Fairview
- Frederick
- Guthrie
- Guymon
- Hobart
- Holdenville
- Hollis
- Hugo
- Idabel
- Jay
- Kingfisher
- Lawton
- Madill
- Mangum
- Marietta
- McAlester
- Medford
- Miami
- Muskogee
- New Cordell
- Newkirk
- Norman
- Nowata
- Okemah
- Oklahoma City
- Okmulgee
- Pauls Valley
- Pawhuska
- Pawnee
- Perry
- Poteau
- Pryor
- Purcell
- Sallisaw
- Sapulpa
- Sayre
- Shawnee
- Stigler
- Stillwater
- Stilwell
- Sulphur
- Tahlequah
- Taloga
- Tishomingo
- Tulsa
- Vinita
- Wagoner
- Walters
- Watonga
- Waurika
- Wewoka
- Wilberton
- Woodward
|
The 100 most populous cities of the United States
| |
| |
- New York, New York
- Los Angeles, California
- Chicago, Illinois
- Houston, Texas
- Phoenix, Arizona
- Philadelphia, Pennsylvania
- San Antonio, Texas
- Dallas, Texas
- San Diego, California
- Austin, Texas
- Jacksonville, Florida
- San Jose, California
- Fort Worth, Texas
- Columbus, Ohio
- Charlotte, North Carolina
- Indianapolis, Indiana
- San Francisco, California
- Seattle, Washington
- Denver, Colorado
- Oklahoma City, Oklahoma
- Nashville, Tennessee
- El Paso, Texas
- Washington, D.C.
- Las Vegas, Nevada
- Boston, Massachusetts
|
- Portland, Oregon
- Louisville, Kentucky
- Memphis, Tennessee
- Detroit, Michigan
- Baltimore, Maryland
- Milwaukee, Wisconsin
- Albuquerque, New Mexico
- Tucson, Arizona
- Fresno, California
- Sacramento, California
- Mesa, Arizona
- Kansas City, Missouri
- Atlanta, Georgia
- Colorado Springs, Colorado
- Omaha, Nebraska
- Raleigh, North Carolina
- Virginia Beach, Virginia
- Long Beach, California
- Miami, Florida
- Oakland, California
- Minneapolis, Minnesota
- Tulsa, Oklahoma
- Bakersfield, California
- Tampa, Florida
- Wichita, Kansas
|
- Arlington, Texas
- Aurora, Colorado
- New Orleans, Louisiana
- Cleveland, Ohio
- Anaheim, California
- Honolulu, Hawaii
- Henderson, Nevada
- Stockton, California
- Riverside, California
- Lexington, Kentucky
- Corpus Christi, Texas
- Orlando, Florida
- Irvine, California
- Cincinnati, Ohio
- Santa Ana, California
- Newark, New Jersey
- Saint Paul, Minnesota
- Pittsburgh, Pennsylvania
- Greensboro, North Carolina
- Lincoln, Nebraska
- Durham, North Carolina
- Plano, Texas
- Anchorage, Alaska
- Jersey City, New Jersey
- St. Louis, Missouri
|
- Chandler, Arizona
- North Las Vegas, Nevada
- Chula Vista, California
- Buffalo, New York
- Gilbert, Arizona
- Reno, Nevada
- Madison, Wisconsin
- Fort Wayne, Indiana
- Toledo, Ohio
- Lubbock, Texas
- St. Petersburg, Florida
- Laredo, Texas
- Irving, Texas
- Chesapeake, Virginia
- Glendale, Arizona
- Winston-Salem, North Carolina
- Scottsdale, Arizona
- Garland, Texas
- Boise, Idaho
- Norfolk, Virginia
- Port St. Lucie, Florida
- Spokane, Washington
- Richmond, Virginia
- Fremont, California
- Huntsville, Alabama
|
|
|
Cities ranked by United States Census Bureau population estimates for July 1, 2022.
|
Authority control databases  |
| International |
|
| National |
- Germany
- United States
- France
- BnF data
- Croatia
- Israel
|
| Geographic |
|
| Other |
|